


1. Introduction
Taking the case of the island city of Macau, this study introduces a new method for comparing urban morphological layouts using machine learning and investigates the potential benefits of combining urban morphological analysis with machine learning techniques. As a Chinese city under Portugal’s control for more than 450 years, the traditional urban morphological core of the island city of Macau has previously been compared with urban areas in China and the West (Jiang et al., 2023; Zheng, 2016), and Macau’s urban fringe belt has attracted the interest of urban morphologists (He, 2018). Macau is not only an exceptional case combining Chinese and Portuguese urban morphology research but also facilitates comparison of Chinese and Western cities with comparable cultural backgrounds. The present paper asks whether there is a morphological connection between Macau and the traditional Portuguese city as a result of cultural influence that has lasted for more than 450 years. To address this question, the researchers use machine learning techniques to identify and compare the urban morphologies of four typical island and port cities in Asia (Macau, Dili, Malacca, and Goa) within Portugal’s Maritime Silk Road trade network and explore the similarities and differences between them.
1.1. Macau’s development on the Maritime Silk Road
The early maritime traders of the ancient Lingnan area started from the ports of Guangzhou, Macau, and Quanzhou on China’s southeast coast and carried out increasingly close commodity transactions, craft transmissions, personnel exchanges, and mutual learning of civilizations with countries in Asia, Africa, and Europe (Macau SASC, 2022). This so-called Maritime Silk Road is the world’s oldest known long-distance sea route, providing an important conduit for global maritime trade at that time.
During the 15th Century expansion of European power, the Portuguese Empire spread overseas, and mutual cultural influence gradually facilitated maritime trade (Boxer, 1976; Sieber, 2001). The Portuguese trade route first occupied Colicut (Cochin) and Goa on the Indian Peninsula, extending all the way to the Indonesian port of the Sumatra Islands, and then expanded to Java Island, Borneo (Kalimantan Islands), and the Moluccas (Maluku Islands). To establish their colonial power, the Portuguese ultimately occupied the Malacca Islands and other ports that facilitated east‒west shipping (Desai, 1969; Wijaya, 2022). As the Portuguese Empire grew, so did its trading networks. In Asia, traders exchanged spices and other goods for gold, silver, fine textiles, and rice. Portuguese ships with royal charters carried goods from Lisbon, Goa, and Cochin to Macau. Their presence in Macau also enabled the Portuguese to participate in the lucrative Southeast Asian trade among China, Japan, Malaysia, and Indonesia. Merchant ships sailed regularly from Indonesia’s Spice Islands (Molucas) to Macau, from Goa to Macau, and from Macau to Indonesia, Siam, and Timor. The development of these port cities was interdependent.
Therefore, the port of Macau was the hub of the maritime arteries of Europe, Asia, and Africa during this period (Leandro, 2019; Perez-Garcia, 2022). The commercial factors of maritime trade and the strict implementation of China’s maritime embargo policy encouraged Macau, then under Portuguese administration, to engage in foreign trade. In the 16th and 17th centuries, Macau became an important international trade port on the Asian seas (Ptak, 2006). Macau’s early re-export trade reached its peak from the 1680s to the 1740s.
Cultural exchange along Portugal’s East Asian and Southeast Asian trade network has been thoroughly studied. However, little attention has thus far been given to how Portuguese-led trade routes influenced the morphological characteristics of island and port cities. This is the topic of the present paper.
1.2. Literature review
The study of urban morphology is essential to the study of the form of human settlements, the processes of their formation and transformation, and urban planning and design (Cirella et al., 2022; Kropf, 2009). Urban morphology refers to the physical elements that compose and shape a city, such as streets, public spaces, blocks, lots, and buildings (Osmond, 2010). This term refers to the study of the physical and spatial characteristics of urban fabric as a whole.
Urban morphology research has evolved into various schools, such as those advanced by Michael Robert Günter Conzen, Gianfranco Caniggia, and Bill Hillier (Gauthiez, 2004; Oliveira, 2016). The Conzen school advocates the historical geographical method, focusing on the ‘burgage cycle,’ morphological frame, and morphological region as well as the ‘fringe belt’ (Whitehand & Morton, 2004). It also focuses on analysis of three elements of urban layout: streets, plots, and block plans (Conzen et al., 2012). Caniggia’s Italian school focuses on typological processes, urban organization, and synchronic variation of types (F. Chen, 2010). By analyzing topological spaces, Hillier’s space syntax school investigates the impact of interactions between individuals and spaces (Dursun, 2007; van Nes & Yamu, 2017). In its early days, the space syntax school mainly focused on pedestrian movement patterns, but recent research has also gradually covered space recognition, methodological development, and architectural form (Oliveira, 2016). Classical urban morphology research mainly analyzes the evolution of urban spatial morphological characteristics and their economic and social effects through the abstraction of basic spatial morphological characteristics such as building, open spaces, blocks, streets, and land uses (Bertyák, 2021). In this process, the analytical methods mainly rely on researchers’ manual analysis and empirical interpretation. For example, the Conzen school primarily conducts analysis and research on large-scale historical maps (Whitehand 2004). Urban morphology research on island cities is another branch of the discipline.
1.2.1. Urban morphology of island cities
Island cities are mainly divided into river islands, lake islands, estuary islands in delta or lagoon environments, and other offshore islands close to the mainland (Grydehøj, 2015). They exist as single islands or archipelagos. Macau is an island city in China’s Pearl River Delta. From the research perspective of island cities, some scholars have noted that Macau has experienced urban fragmentation, and the scarcity of land associated with the island’s limited space has encouraged dense and progressive urban expansion. At the same time, the land scarcity has also caused traffic problems and environmental inequality and affected future urban development, further influencing the evolution of Macau’s urban form (Sheng et al., 2017). Xie, B, and others conceptualized the ancient Maritime Silk Road as a centerless network of archipelago relationships and proposed a relational island study approach to analyze the ancient Maritime Silk Road (Xie et al., 2020).
In addition, some studies have focused on the evolution of the urban form of island cities to reveal their urbanization growth process. For example, scholars have evaluated the spatial changes in the morphology of Lagos Island and their impact on the development of the island over longer or shorter periods as well as the effects of physical planning policies (Adenaike et al., 2020; Akindeju et al., 2022). Jian Zhou et al. (2013) applied the comprehensive land use and transportation modeling system TRANUS to explore the relationship between urban transportation energy consumption and changes in settlement morphology in Xiamen Island, China. Studies of spatiotemporal evolution in island urban agglomerations include research into George Town in the Strait of Malacca (Zhao et al., 2019), the Canary Islands in Spain (Temes Córdovez et al., 2018), the Abu Dhabi urban archipelagos (Mishra, 2014), Mombasa in Kenya (Steyn, 2015), and the Zhoushan Archipelago in China (Zhang & Grydehøj, 2021). There has nevertheless been little research into the correlation between island cities and urban form. The present paper addresses this gap.
1.2.2. Technical methods for comparing urban forms
In addition to the study of single-island and archipelagic urban forms, scholars have more broadly conducted comparative case studies of different urban forms (e.g., Conzen et al., 2012; Oliveira & Pinho, 2006; Wang & Zheng, 2018). These comparative studies, which are often cross-cultural, primarily investigate the development characteristics of different cities, as well as the similarities and differences between two or more cases.
However, human-made qualitative judgments and manual operations are easily affected by subjective cognition, which leads to deviations in analysis. Therefore, some scholars have begun to explore the combination of urban analysis and other quantitative methods. For example, satellite images and remote sensing data were used to compare the morphology of 77 metropolitan areas in Asia, the United States, Europe, and Latin America (Huang et al., 2007); linear regression analysis and 18 spatial indicators combined with GIS were used to quantify the urban morphology of Salt Lake County (Lowry & Lowry, 2014); Getis-ord Gi* statistics and correlation analysis were combined by analyzing the spatial patterns of urban characteristics and their resilience to, recovery from, and adaptability to crises (Casali et al., 2024); urban form analysis was combined with spatial syntax and GIS (Griffiths et al., 2010; Ye & van Nes Nes, 2014); and studies on temporal morphology were carried out by looking at graphs (network theory), typically involving quantitative analysis at the street network level (Masucci et al., 2013).
The classical analysis method of urban morphology is still widely recognized and plays an important role in laying the foundations for the field. Cities have diverse characteristics and cannot all be assessed in the same manner, and subjective experience alone is insufficient for refining and humanizing the development of future urban design. For urban morphology research to progress from descriptive to explanatory and even predictive levels, the timely introduction of new methods or new perspectives has become an absolute necessity.
1.2.3. Machine learning interventions in urban morphology analysis
Research on urban morphology that combines artificial intelligence and machine learning technology methods has begun. Such approaches aim to better consider the goals of sustainable development and propose feasible solutions in the short-, medium-, and long-term using machine learning algorithms to control, monitor, and predict future trends in urban form indicators. In particular, research on land value, urban structure types, land use areas, urban land cover, urban growth, and urban functions is relatively common (Tekouabou et al., 2022). There are also scholars who combine convolutional neural network (CNN) for computer vision tasks, such as slum identification and detection (Verma et al., 2019), or combine generative adversarial network (GAN) to generate new reasonable example data, such as urban landscape, layout, urban design, or urban growth (Shafizadeh-Moghadam et al., 2017), or combine this approach with the YOLO (You Only Look Once) algorithm to explore potential tourism areas (Y. Chen et al., 2023). In addition, the main topics currently involving machine learning in urban form analysis include predicting the height of urban building forms, classifying the form of East Asian megacities, quantifying the impact of urban form on surface temperature in subtropical high-density urban areas, developing machine learning based on urban form data frameworks to identify specific locations for transportation travel, rapidly estimating the impact of buildings and urban morphology on residential heat loads, and studying the impact of COVID-19 case distribution on Macau’s urban form (C. Y. Chen et al., 2024; Y. Chen et al., 2022; Milojevic-Dupont et al., 2020; Moosavi, 2022; Wagner et al., 2022). These studies focused on solving certain types of urban problems related to factors such as ecology, transportation, energy, and public health to achieve sustainable urban development. However, few studies have combined the perspectives of ancient maps and historical geography to explain the shared characteristics of cities, and further exploration is needed.
2. Materials and Methods
2.1. Machine learning technology and research scope
This study aims to explore the influence of traditional Portuguese cities on the urban form of Asian Maritime Silk Road ports. Researchers need a technology that can efficiently and accurately extract architectural and urban layout features from complex urban geography images. We selected YOLOv4, one of the many available neural network frameworks (Bochkovskiy et al., 2020), for this study due to four reasons. First, YOLOv4 can adapt to the complexity of urban morphological characteristics as urban morphology research relies on an understanding of the complex interactions of spatial structures, including street configurations, building groups, and public spaces. Through its advanced feature extraction network (CSPDarkNet53), YOLOv4 is able to effectively capture and analyze these complex spatial structures, which are crucial for understanding urban layouts. Second, for its real-time processing and big data compatibility. Urban morphology analysis usually requires the processing of a large amount of geographical information image data. The efficient computing power of YOLOv4 can quickly process these large datasets and provide real-time analysis feedback, which is particularly important for dynamically assessing changes in urban form and development patterns. Third, because of its accuracy and small object detection capabilities. In urban morphology analysis, correctly identifying small-scale architectural elements (such as historical building features) is a challenge. Through spatial pyramid pooling and path aggregation network technology, YOLOv4 improves the recognizability of small targets, ensuring model accuracy and detail retention when extracting urban morphological features. Fourth, due to its cross-cultural and cross-geographic adaptability. The flexibility and parameter adjustment capabilities of YOLOv4 allow it to adapt to the specific morphological characteristics of different cities, facilitating cross-city and cross-cultural comparative research. While YOLOv4 was chosen because it works well technically, what truly mattered was how well it fit with the main goals of this study, which were to quickly and accurately compare and analyze the physical features of cities inhabited by people from different cultures.
The specific steps are as follows. First, Portuguese city image data (mainly the block-plan form represented by the architectural footprint) are collected as a training set for machine learning. Second, the YOLOv4 neural network framework is used to train the machine so that it can learn the rules of the urban building footprint that are difficult for humans to observe, enabling it to accurately identify the Portuguese building footprint. Finally, the building footprint map of Macau is input into the algorithm so that the machine can identify regions that are comparable to those of cities in Portugal. In the selection of samples, the urban areas of world cultural heritage in Portugal and Macau under the same heritage value system were considered first: Evora Historic Center (designated a World Heritage Site in 1986), Porto Historic Center (designated a World Heritage Site in 1996), Guimaraes Historic Center (designated a World Heritage Site in 2001), and the Historic Center of Macau (selected as a World Heritage Site in 2005). In addition, the old town of Lisbon retains numerous historical buildings from the 12th century, and the urban fabric has a high degree of integrity, both of which are included in this study’s sample for future comparisons.
2.2. Sample processing: making square slices
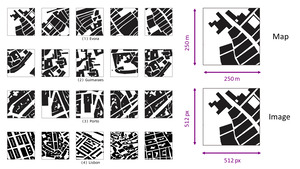
Due to the complexity of the building footprint, which reflects architectural form, density, history, and other factors, this variable was utilized in this study. This study utilizes building footprint data from the Mapbox (https://www.mapbox.com/), which contains relatively accurate records of the building footprints of numerous Portuguese cities. Figure 1 shows black-and-white images of the urban fabric of four different Portuguese cities: Évora, Guimarães, Porto, and Lisbon. The images show an abstract representation of each city’s street layout and building footprints, with black areas representing buildings and white areas representing open spaces such as streets and squares. (1) Évora: Images of Évora show more regular streets and a compact building layout. This design reflects the traditional urban fabric, where the regular arrangement of streets and plots provides a clear image of urban morphology. (2) Guimarães: In comparison, the urban fabric of Guimarães exhibits some irregularities. However, overall, it still maintains a relatively regular street layout. In areas with a long history, this structure is common in urban morphology. (3) Porto: In the image of Porto, we can observe a more complex urban texture. The mix of regular and irregular street networks, as well as open spaces of varying sizes, illustrate the city’s rich historical layers and spatial variation. (4) Lisbon: The urban form in Lisbon’s images is more diverse and modern. This city showcases wide streets and open spaces of varying sizes, as well as an irregular arrangement of buildings, reflecting the dynamic and diverse urban fabric of a modern metropolis.
In this study, the slice size and shape used have a significant impact on the results of the urban morphology analysis. The purpose of selecting image slices is to extract representative urban areas so that machine learning models can analyze their urban texture and layout. In terms of the shape of the slices, this study uses square slices for two primary reasons. Uniformity and consistency: Square slices provide a unified perspective on urban morphological characteristics and facilitate standardized comparisons across cities. Simplified calculation: The square geometry simplifies the computational process of image processing and analysis because it has the same length in the vertical and horizontal directions, which simplifies feature extraction and analysis.
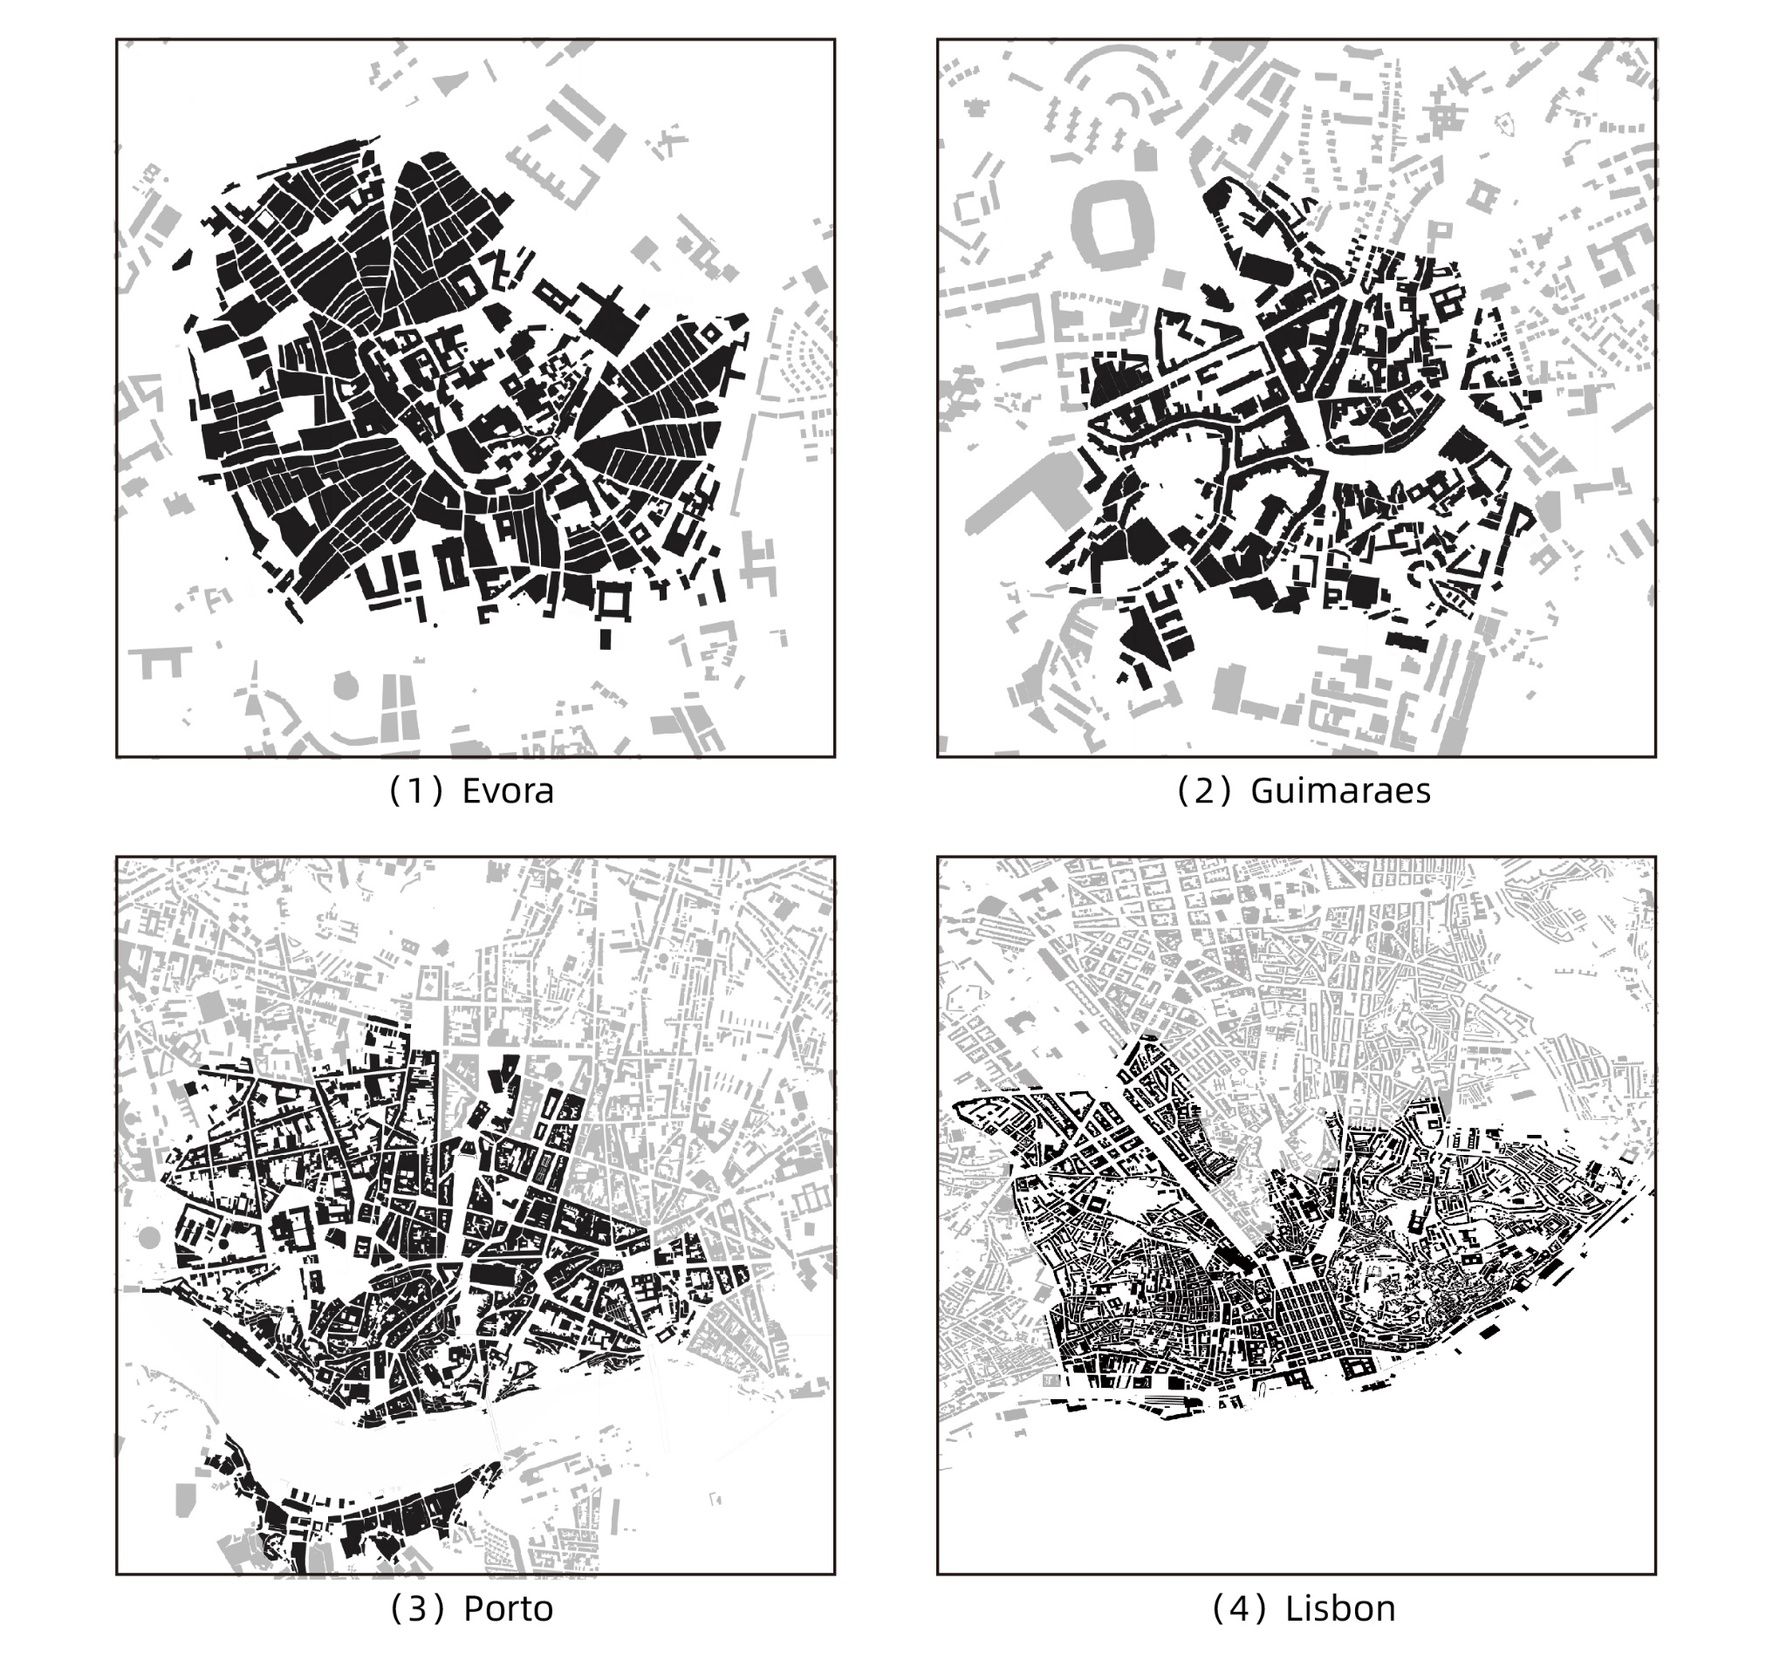
The following steps were used to select specific sampling areas and slices for this study. Identification of urban geographical centers and important areas: This study identified the geographical center of each city and important areas for urban development, such as historical protection districts. Historical data and map analysis: Researchers identified representative buildings and street layouts in the city by analyzing historical maps and existing geographic information system (GIS) data. Uniform distribution sampling: Within a determined area, a uniform distribution method was used to randomly select slices to ensure coverage of different parts of the city and maintain the diversity and representativeness of the sample. Resolution and scale: The selected slice size is 250 × 250 meters, and the corresponding image size is 512 × 512 pixels (Figure 2). This size is sufficient to contain adequate urban morphology information, but at the same time, it is not too large to be difficult to process.
Additionally, it is important to note that changing the size or shape of the slices may have an impact on the results. For example, larger slices may contain more information but may also introduce unnecessary background noise, while smaller slices may focus on specific details but may ignore the broader urban environment. Changes in shape, such as using rectangular or circular slices, may alter the type and number of urban elements included, which in turn affects the model’s learning and recognition performance. As a result, in the study of urban morphology, the selection of image slices is critical to the accuracy and efficiency of the analysis. Due to differences in the extent of historical urban areas in different cities, the number of samples taken from each city varies, and 58–123 samples were ultimately collected from four Portuguese cities.
2.3. Object detection model: YOLOv4 framework technology
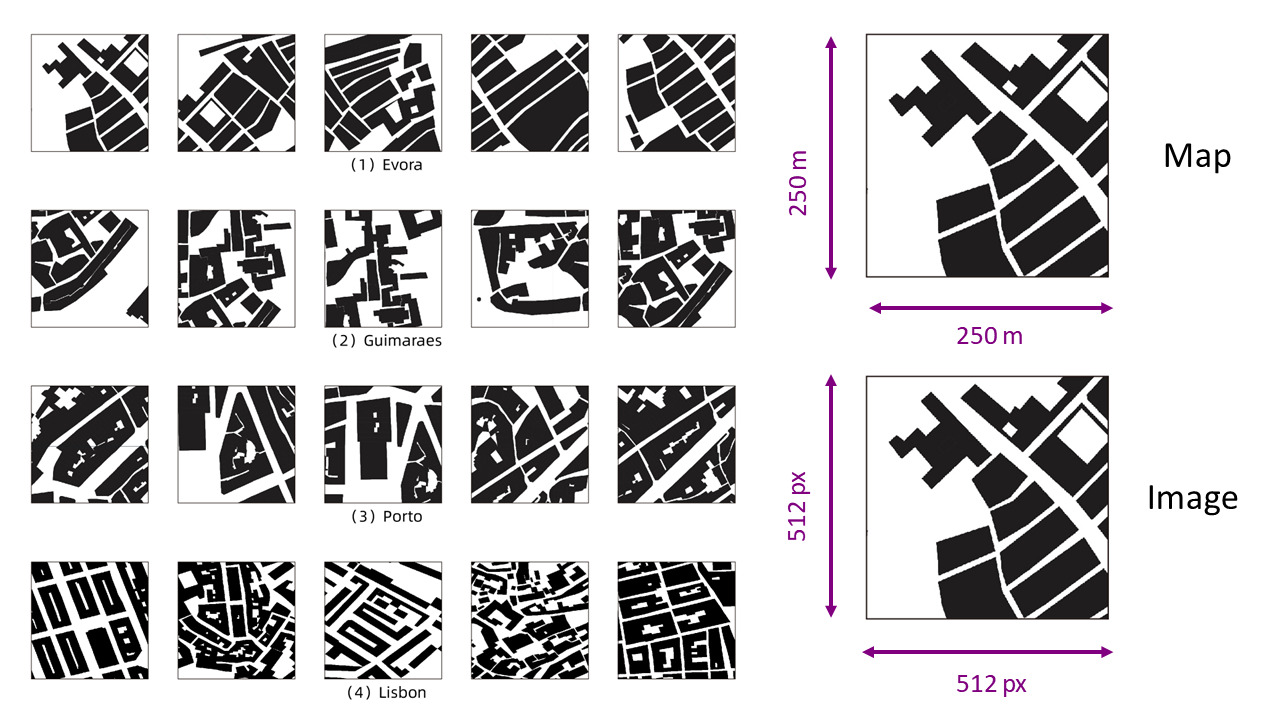
Researchers used machine learning for object detection to compare the similarity of building footprints between cities. YOLOv4 was used as the main framework of the neural network. It has excellent recognition accuracy and efficiency and uses CSPDarkNet53 as the backbone for the feature extraction network. The entire network contains 72 convolutional layers, which significantly improves the overall performance. Its network structure has three major characteristics. First, the backbone of the feature extraction network is CSPDarkNet53, which promotes the fusion of underlying information and enhances the feature extraction ability. Second, the pooling of the spatial pyramid uses SPP, which performs the maximum pooling in the last layer of the output with four different scales, effectively extracting the most significant contextual features. Third, on the basis of the feature pyramid network FPNet structure, which is further improved into the path aggregation network PANet (Liu et al., 2018), a top-to-bottom structure is added to the bottom-up structure of FPNet to further extract and fuse the features of different scales.
The framework of YOLOv4 is shown in Figure 3. Spatial pyramid pooling (SPP) is located at the junction of the backbone network and the neck network and transforms the input feature map into feature maps of different sizes through maximum pooling. Then, the feature maps of different sizes (5×5, 9×9, 13×13) are combined with the original feature map through the connection operation as the new feature maps, which can further increase the receptive field of the convolution kernel. In the neck network part of YOLOv4, the feature pyramid network (FPNet) and the path aggregation network (PANet) are used. FPNet connects the feature maps at a high level with the feature maps at a low level through upsampling, which increases the amount of information in the feature maps. The PANet connects low-level feature maps and high-level feature maps through downsampling, which shortens the fusion path between each layer and improves the feature extraction ability of the network.
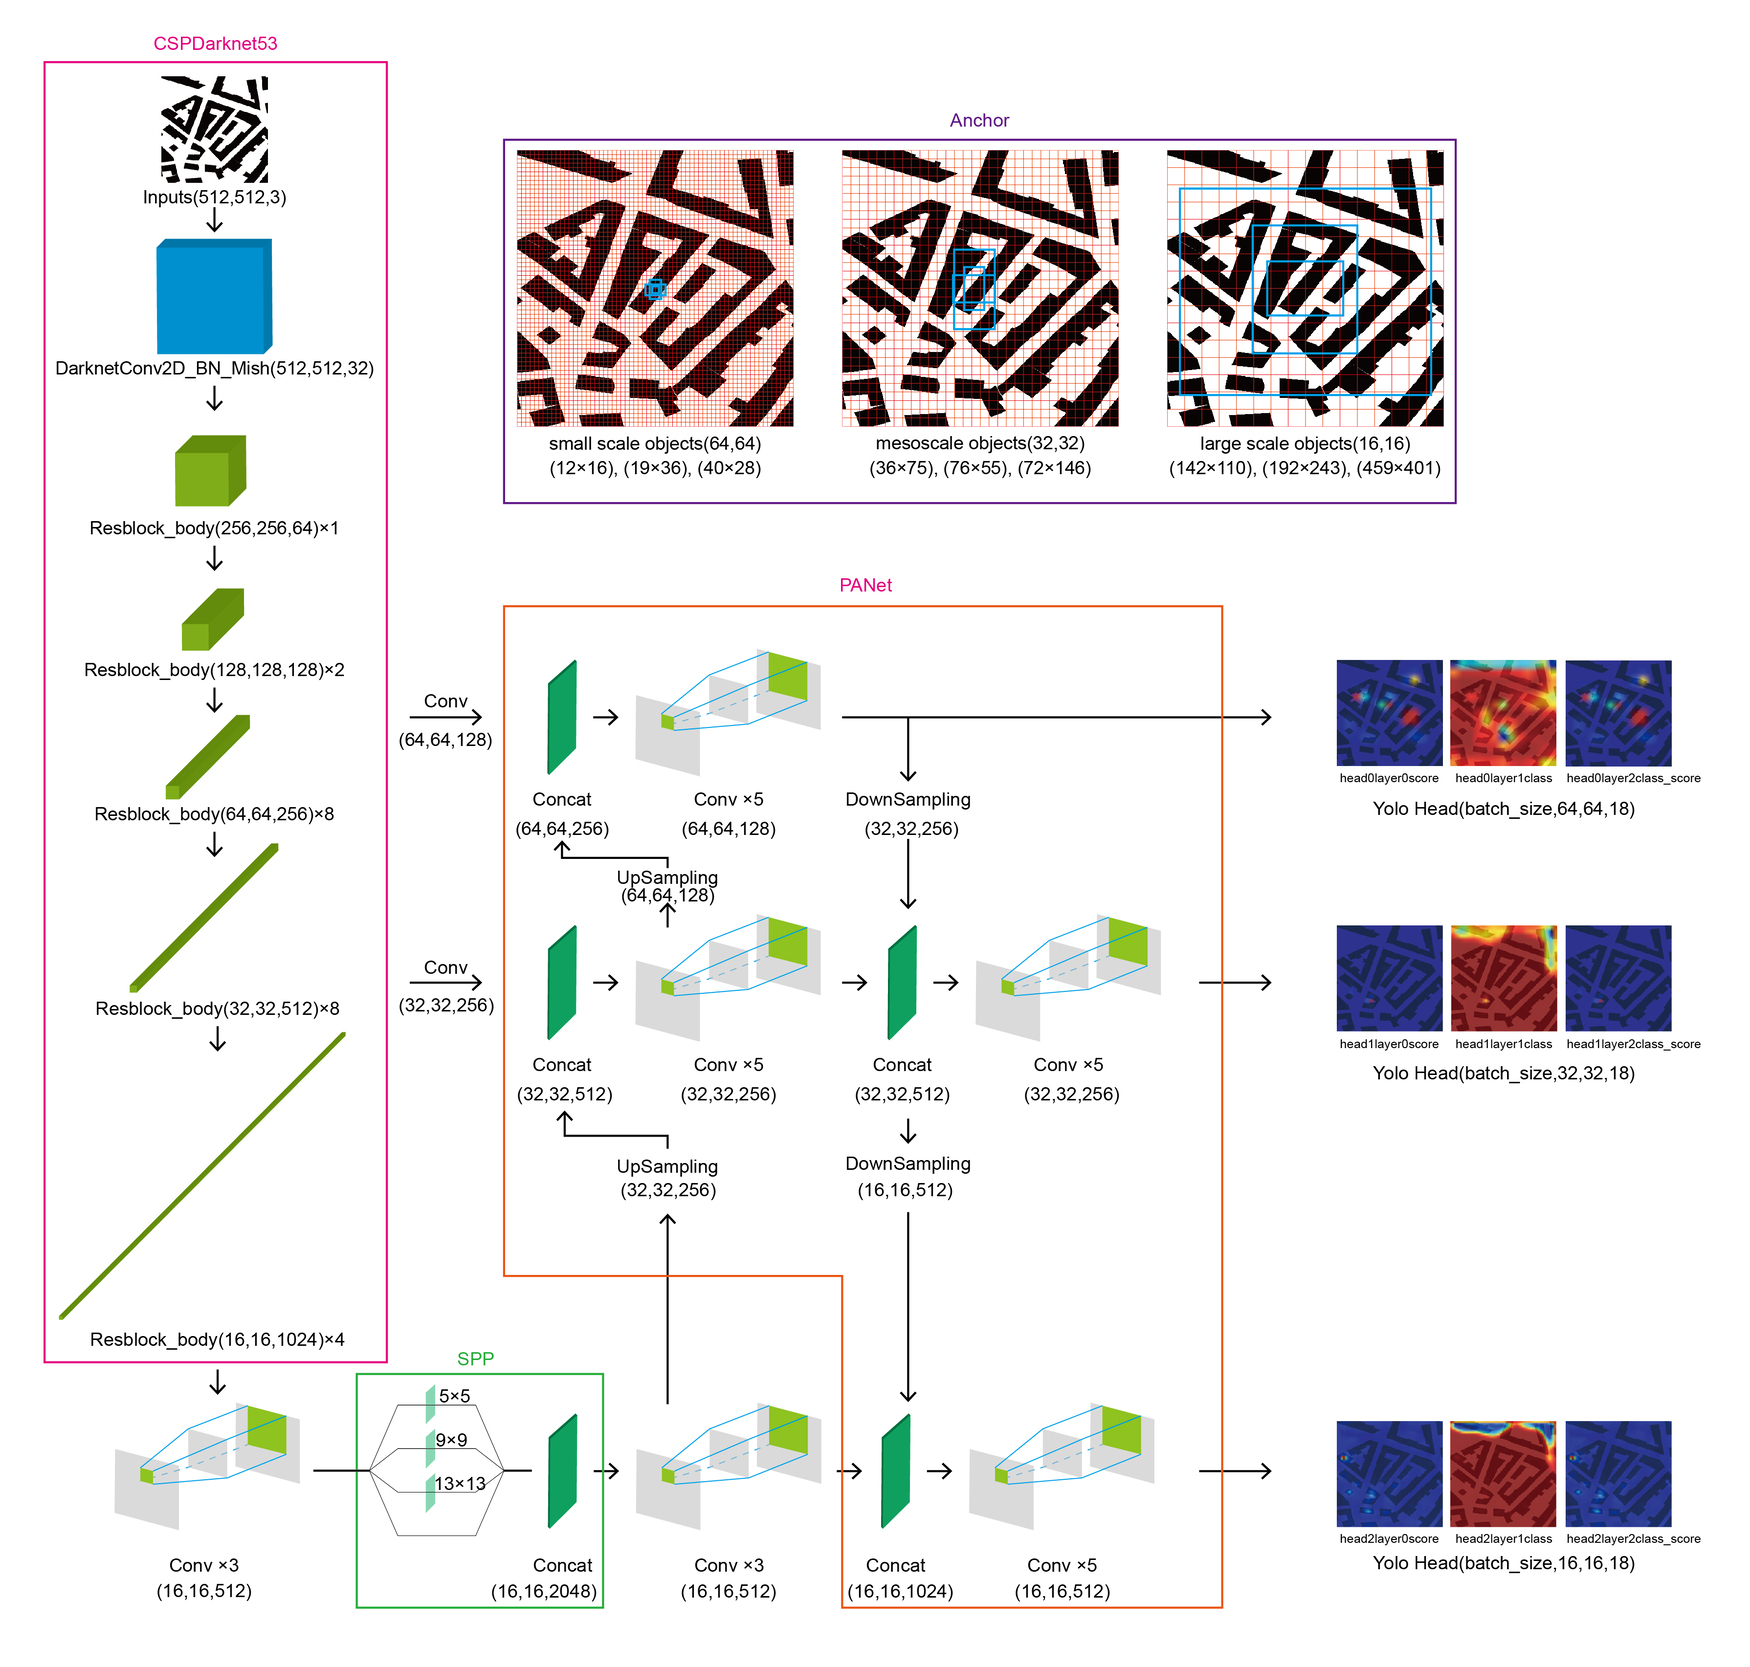
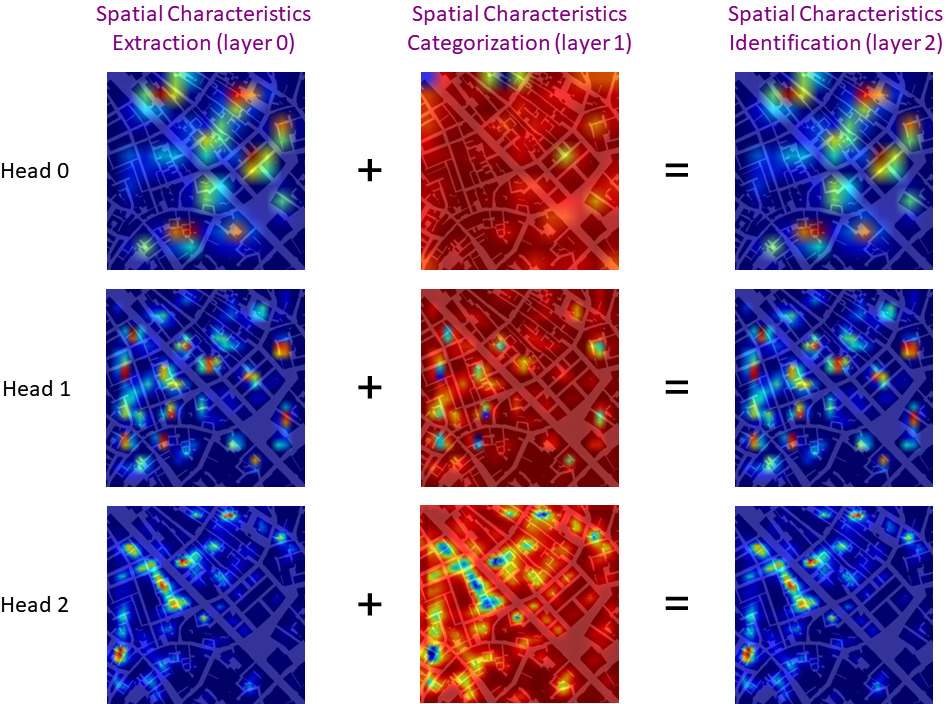
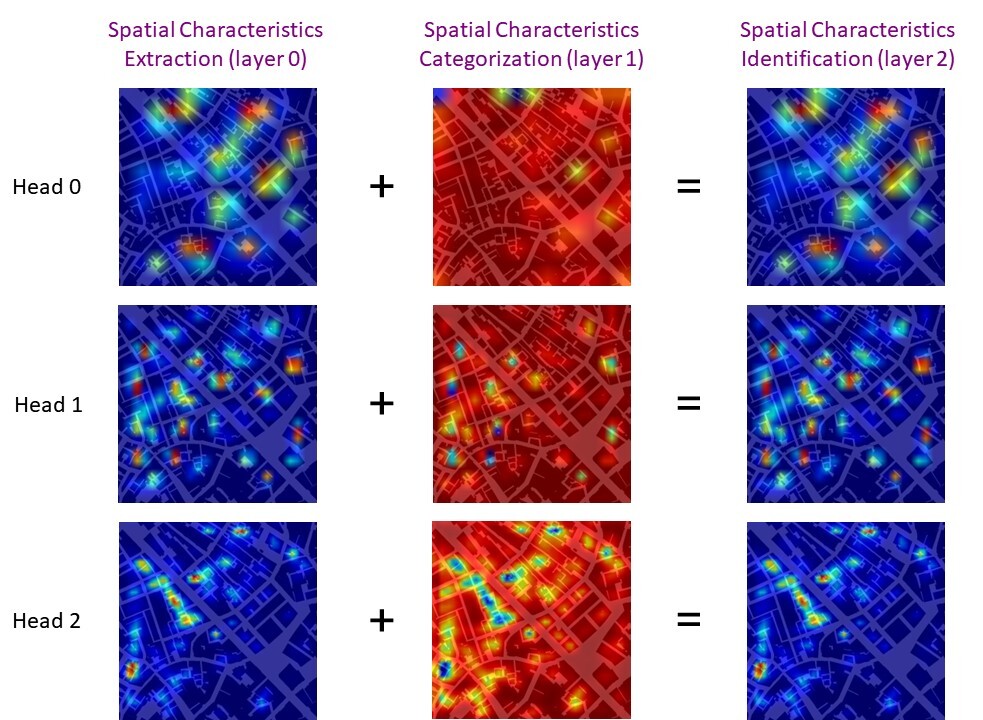
Through the steps of convolution, pooling, upsampling, and downsampling in the above network structures, the obtained features are used to make predictions in the prediction head. The detection head has multiple scales (64×64, 32×32, and 16×16), which solves the problem in which small-scale objects are difficult to predict. Each prediction head contains three layers (Figure 4). Layer 0 represents the value of the confidence of the detection result (red represents the highest confidence, blue represents the lowest). Layer 1 represents the category identification of the detection result (red represents identifiable, blue represents unidentifiable). Layer 2 is the conditional weighting of the two previous layers, that is, excluding the unidentifiable category (blue area) of layer 1 after weighting layer 0 and layer 1. Then, the acquired feature maps are saved in the weighting folder as the material for subsequent prediction analysis.
2.4. Machine learning training process
The configuration of the machine learning environment included Windows 11 (X64), Cuda version 11.5, PyTorch as the deep learning framework, a GeForce GTX 3070 (16G) graphics card, and an AMD Ryzen 9 5900HX (3.30 GHz) processor.. In the training process, a variety of data enhancement methods are used: letterbox cosine annealing learning rate and mosaic data enhancement. Among these processes, the mosaic data enhancement algorithm enhances the model’s capacity to generalize urban morphological characteristics. This method increases the sample diversity in the model training process by synthesizing new training images, thereby helping the model recognize more changes in urban morphology and improving its ability to identify different urban characteristics. However, instead of randomly selecting an image from each city, the researchers selected an image randomly based on research needs. For example, if researchers need to train a YOLO model of Lisbon’s urban from, they can randomly select four images from the Lisbon urban morphology dataset. These four images are from the same city. This choice not only increases data diversity but also simulates the complex and varied urban environments common in urban morphology.
Since the cost of directly learning from scratch on the target domain is too high, the model uses a pretraining model, uses as much training data as possible, and extracts as many common features as possible from these data. This approach can reduce the model’s learning burden for specific tasks. For transfer learning, we trained the model’s backbone feature extraction network using the VOC dataset and set the model’s initialization parameters using the pretraining weights. We trained the model for a total of 110 epochs, evaluated the gradient using the Adam optimizer, and calculated the update step size. Due to the limited number of training sets, the batch size is set to 2, the learning rate is set to 1e-3 for the first 10 epochs, and the backbone feature extraction network is freeze-trained, thereby accelerating the convergence speed and avoiding the destruction of pretraining weights. Then, the learning rate is set to 1e-4 for the later 100 epochs, the backbone feature extraction network is unfrozen, and the entire model is further trained with a smaller initial learning rate, thereby accelerating the training time of the entire network.
2.5. Model accuracy
The researcher uses the convolutional neural network YOLOv4 to conduct in-depth learning and training specifically for the urban texture of the historical center areas of four Portuguese cities: Lisbon, Porto, Évora, and Guimarães. The core goal of this training process is to construct a model that can automatically identify and predict the city to which an image belongs to test the uniqueness and distinguishability of different cities in terms of visual features. This method not only improves the model’s ability to identify urban morphological features but also enables the model to automatically predict the city of origin when receiving new city images. This ability is extremely important for understanding and comparing the urban fabric of different cities, especially in the fields of urban planning and historical research.
By taking the X-axis median (0.5) of the F1 value, we found that the average learning accuracy in the four cities exceeded 50%. The specific values are as follows: 50% in Guimarães, 69% in Évora, 79% in Porto, and 61% in Lisbon (Figure 5). Due to resource and time constraints, the researchers sampled approximately 80–100 learning samples for each city model on average, labeled them manually, and then input them into YOLOv4 for learning and training in the four selected cities. Due to the small size of the city of Guimarães, the number of samples available for study is limited, and its machine learning accuracy reached only 50%, while the learning and recognition accuracy of the other three cities exceeded 60%, among which the learning accuracy of Porto was as high as 79%.
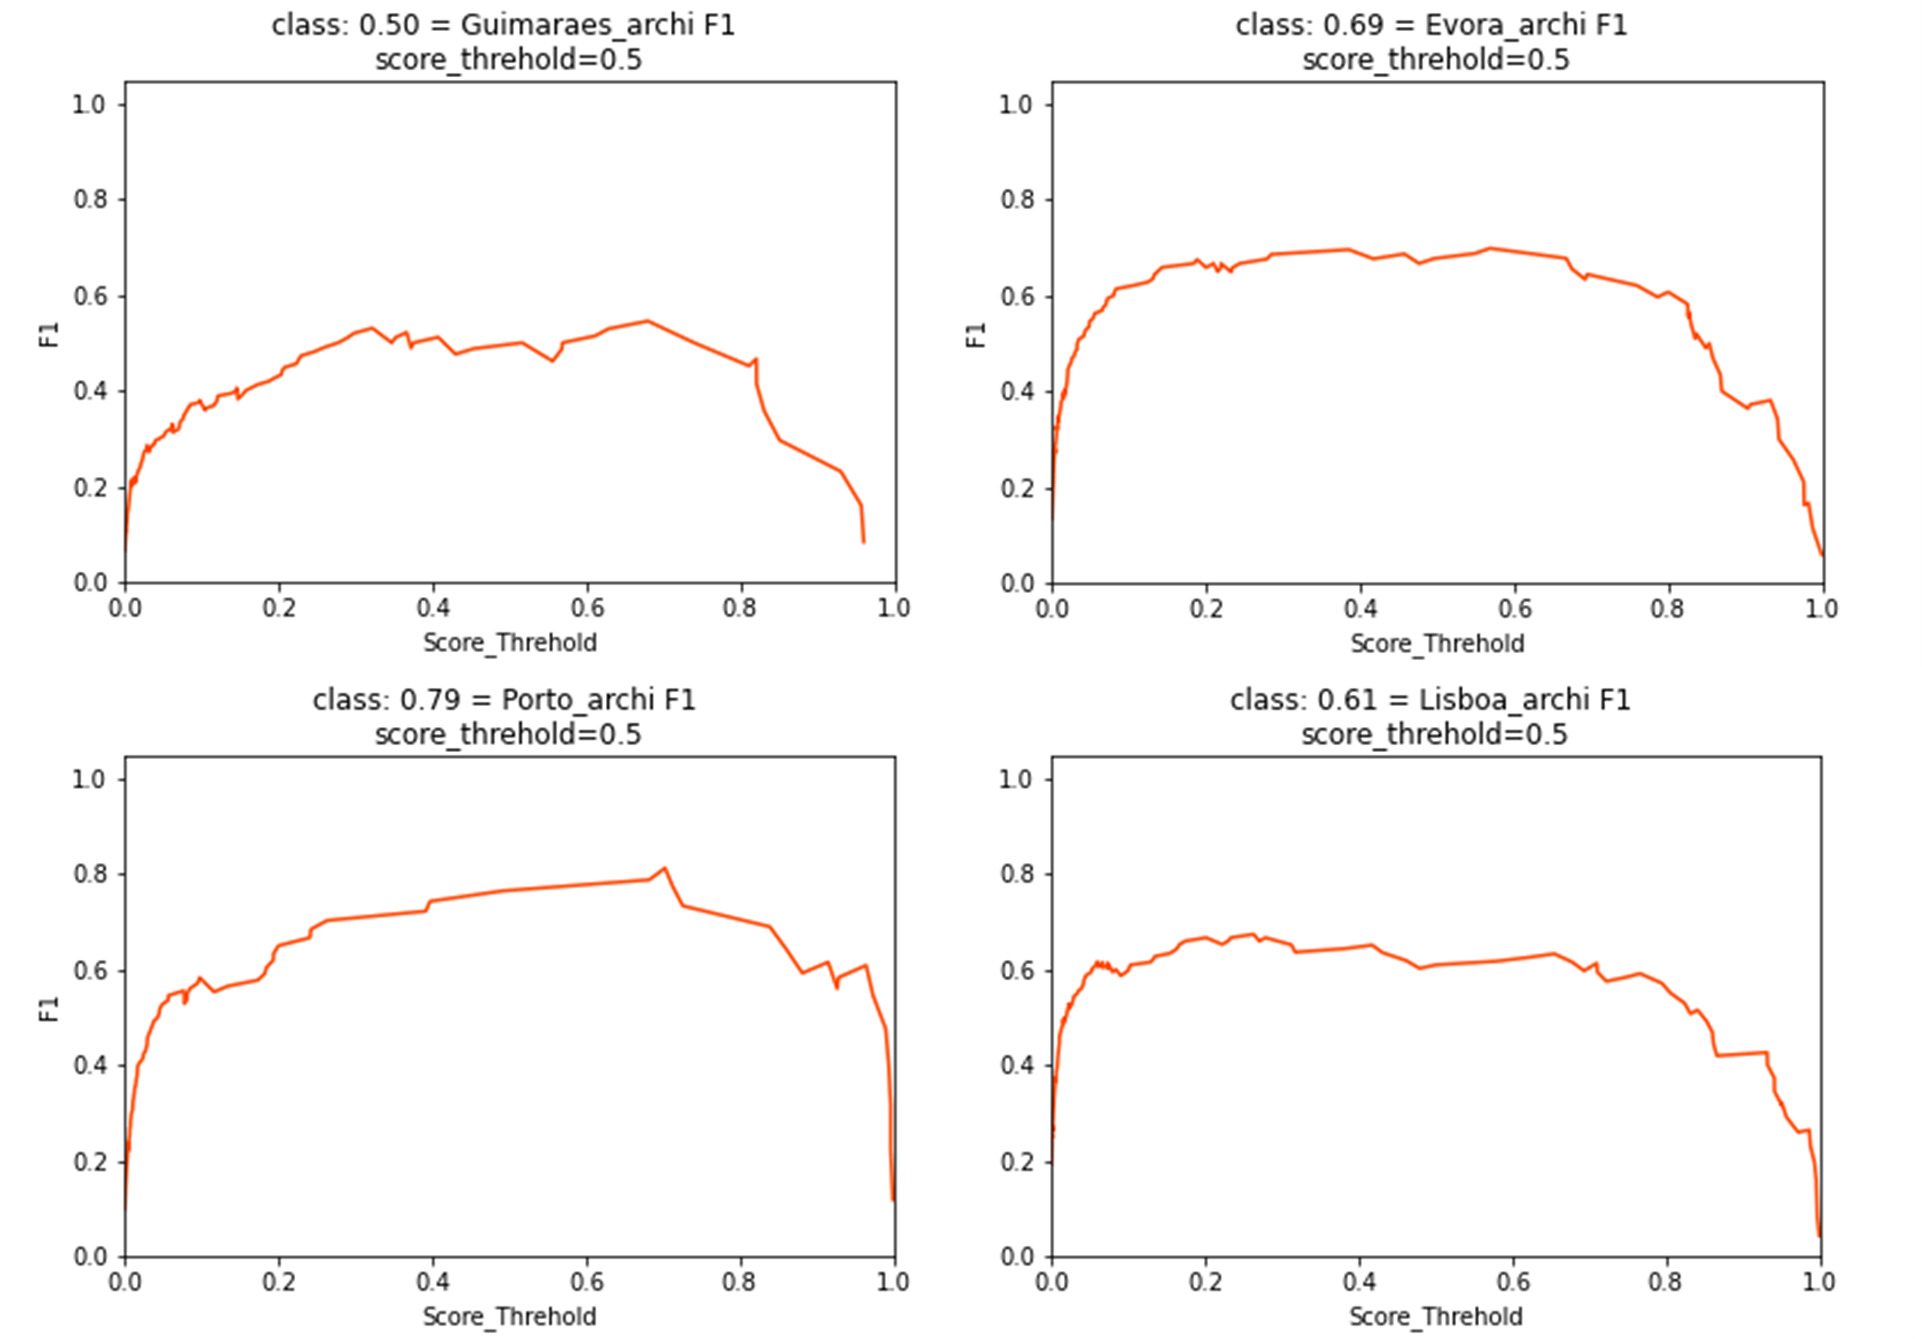
The analysis of these four cities’ machine learning accuracy rates reveals that Évora and Porto have relatively high learning accuracy rates, reaching 69% and 79%, respectively. Lisbon, however, has a low learning accuracy of only 61%. This study shows that, from an urban morphological point of view, the urban layouts of Évora and Porto are more unique and local, i.e., more traditional. In comparison, Lisbon’s overall urban form and texture are richer and more diverse, i.e., more modern, with a more modern morphological texture and urban spatial layout. On the other hand, this study also revealed regular urban forms such as Évora and Porto through the YOLOv4 model accuracy test. Because of its spatial consistency and predictability, the model may achieve higher accuracy in learning and prediction. In contrast, Lisbon’s urban fabric may pose more challenges to the model due to its complexity and diversity, resulting in lower identification accuracy. The limited number of samples may have affected the model’s learning accuracy, explaining only 50% of the accuracy, even though Guimarães exhibited a certain degree of irregularity.
Through in-depth analysis of the learning accuracy of different cities, the high accuracy of the model in this study for Évora and Porto reflects the relatively unique and traditional urban layout of these two cities. The lower accuracy of the model for Lisbon may indicate that Lisbon’s urban form is more modern and diverse, which provides a more complex learning challenge for the model. These findings not only demonstrate the application potential of YOLOv4 in urban morphology analysis but also highlight the impact of different urban morphologies on model training results.
3. Results and Analysis
3.1. Model application: Asian Maritime Silk Road port cities
Macau grew rapidly after Portugal leased land to establish a port there in 1557. As an important international trade transit point, Macau primarily conducted business with Nagasaki in Japan, Manila in the Philippines, Siam and Malacca in Malaysia, Cochin and Goa in India, and cities in Europe (Figure 6). From the standpoint of commodity types and quantities (Table 1), the Maritime Silk Road route operated by the core is the Macau→Malacca→India, Goa→Portugal’s Eurasian route.
In 1640, the Portuguese army became established on the north coast of Timor Island and began to control the sandalwood trade on the island, exporting it from the port to Macau and then transshipping it to the Chinese mainland. For quite a long time, until 1785, the Portuguese had the exclusive right to trade Timorese sandalwood, which thus became Macau’s largest source of profit. In addition, Portugal merged Macau, Timor, and Solo Island into one overseas province at that time and established the Governor’s Office in Macau for management. Dili, the core city of Timor Island, also had frequent exchanges with Macau. Until the 1980s, the cargo route between Timor and Macau still existed, relying on Ponte No. 31 in Macau’s inner port and the nearby Seon-Tat warehouse for cargo transshipment and storage.
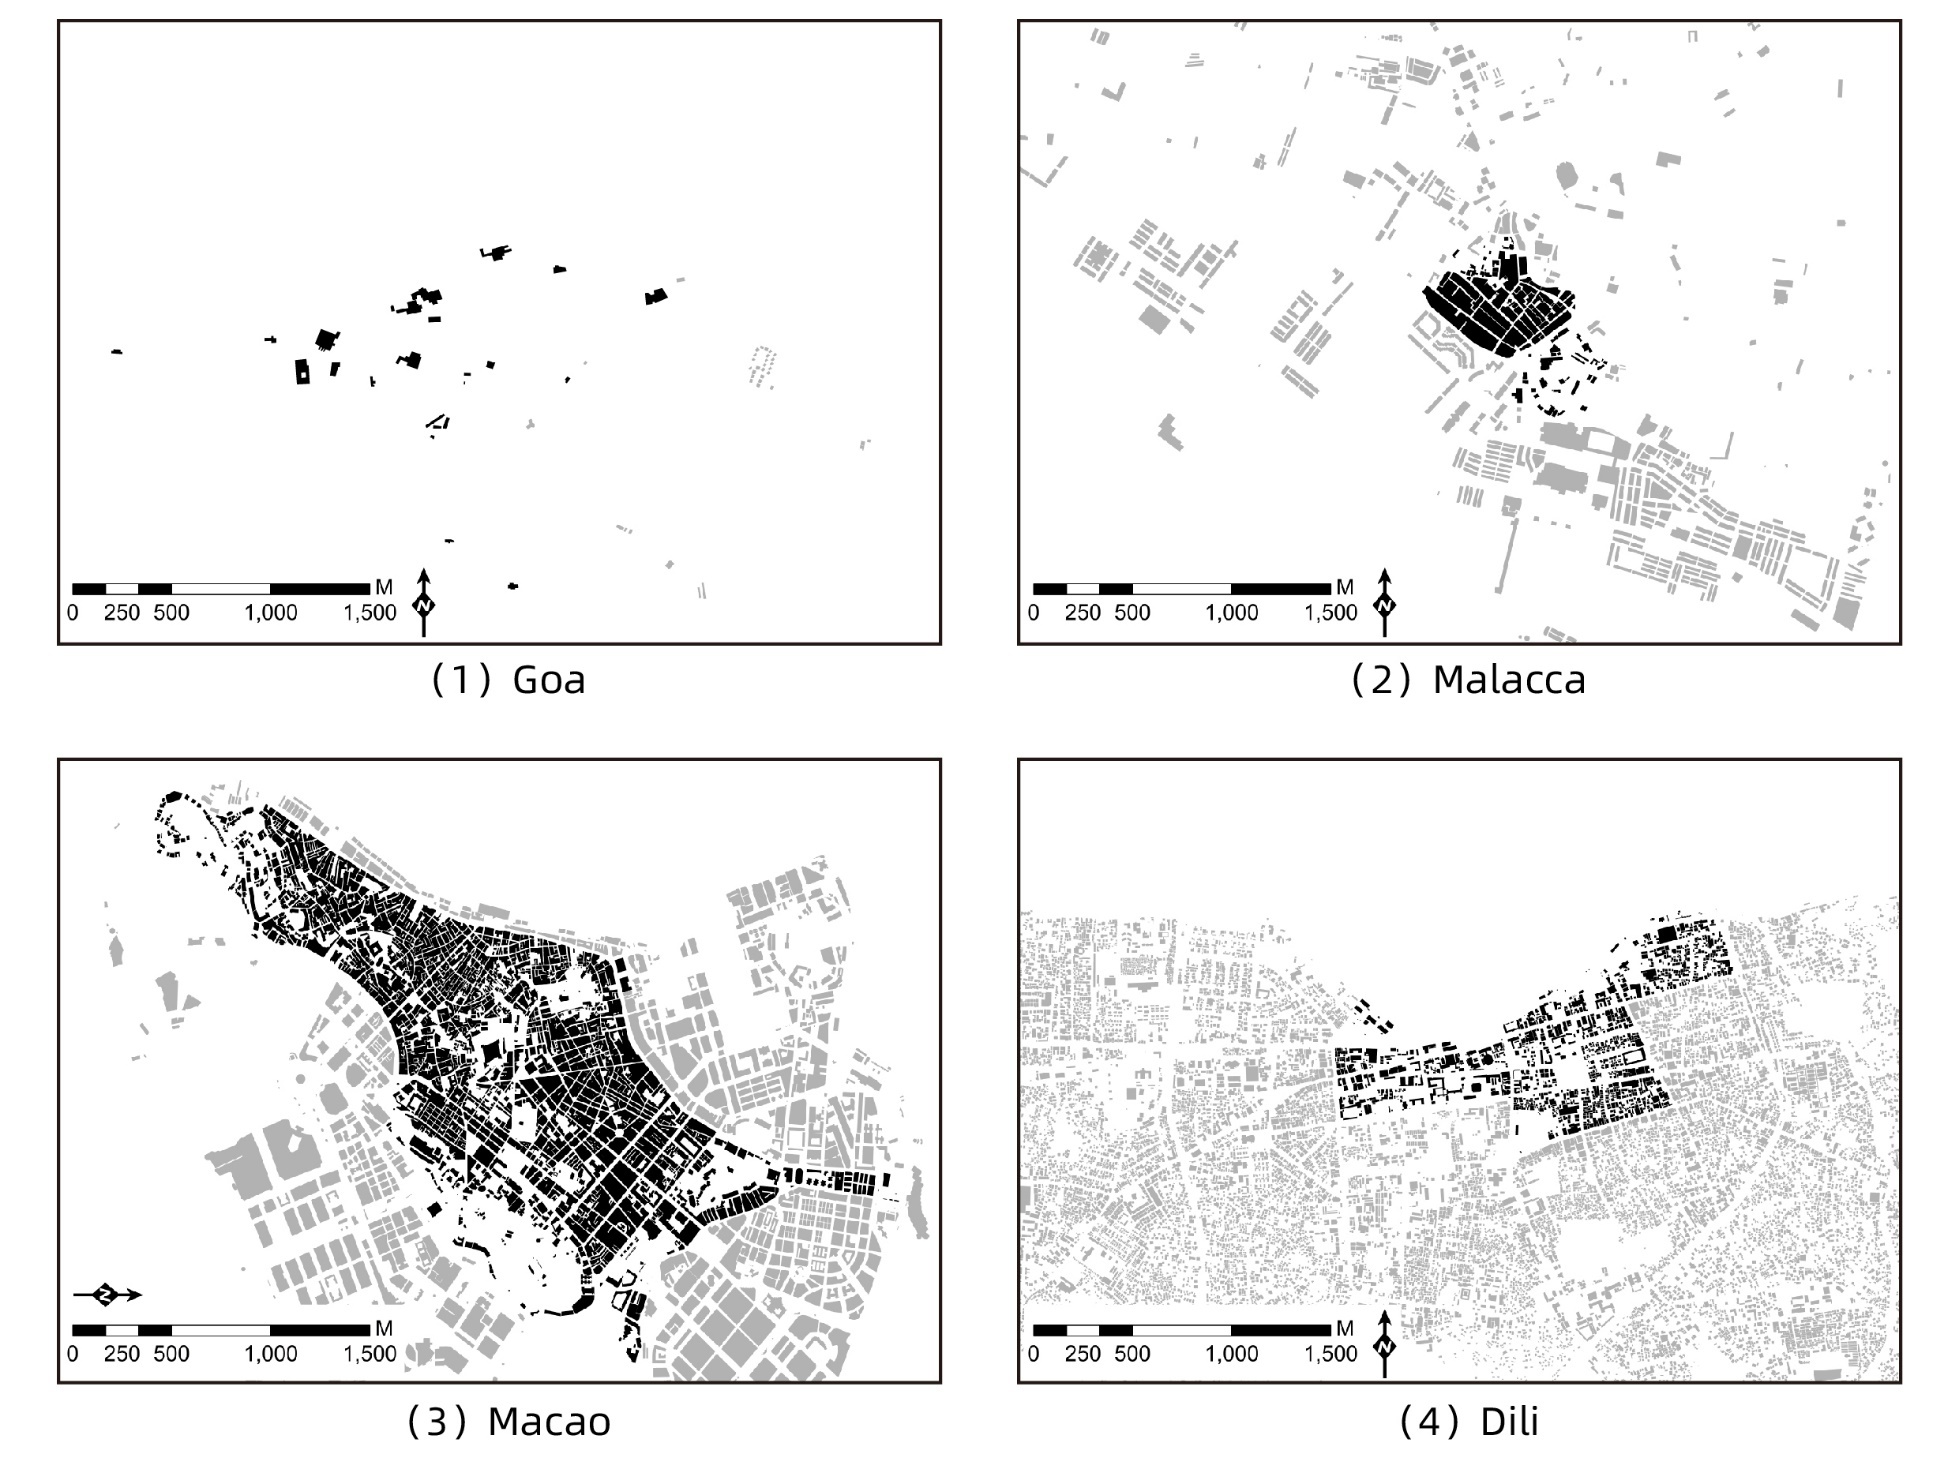
This study applies the model to four main island and port cities on the Asian Maritime Silk Road: Goa, Malacca, Macau, and Dili (Figure 7). Researchers also chose to use building-based imagery data from the Mapbox platform. Using the historical urban areas in the four city samples of Goa, Malacca, Macau, and Dili as the main areas, the researchers intercepted representative building base image slices. The slice is a square area with a side length of 250 meters, and the image size is 512 × 512 pixels. Figure 8 presents black-and-white images of the urban fabrics of these four Portuguese-influenced cities. These slices reveal the following characteristics. (1) Goa’s urban fabric lacks continuity, consistently manifesting as independent building plans within large plots. (2) Compared with Goa, the urban fabric of Malacca maintains a relatively regular street layout as a whole, but the continuity of large land parcels still appears. (3) Images of Macau show relatively regular streets and compact building layouts. Further observation reveals that these blocks of streets, each with varying widths, exhibit a strict hierarchy and branching, a common feature of urban morphology in older areas. (4) The urban form of Dili stands in stark contrast to the first three. It presents a discontinuous and fragmented, almost square-shaped building layout.

The results below come from taking large, medium, and small spatial features from the Portuguese city model (Lisbon, Porto, Évora, and Guimaraes) and applying them to the four Asian island and port cities (Goa, Malacca, Macau, and Dili) to study historic district texture. In urban morphology, different scales usually represent the characteristics of different levels of urban spatial structure. (1) Small scale (microscale): In this study, small scale refers to the range of 250 × 250 meters. This scale is usually consistent with the size of a single block or street and can represent the daily life radius of residents. This size was chosen to capture details in the urban fabric, such as the form of individual buildings, the width and layout of streets, and the public spaces and green spaces within blocks, reflecting the daily behavioral patterns of residents and the interactivity of community life. (2) Mesoscale: A range of 500 × 500 meters is defined as mesoscale, which can cover larger urban areas, such as neighborhood units or multiple block combinations. At this scale, one can observe the continuity of urban space and the relationships between adjacent areas, including traffic circulation lines, the distribution of public service facilities, and functional zoning within the area. (3) Large scale (macro scale): This refers to the scale of the entire urban area, illustrating the overall layout of the urban form and large-scale spatial relationships. This includes the main axes of the city, its boundaries, and the geographical location and relative size of various urban functional areas.
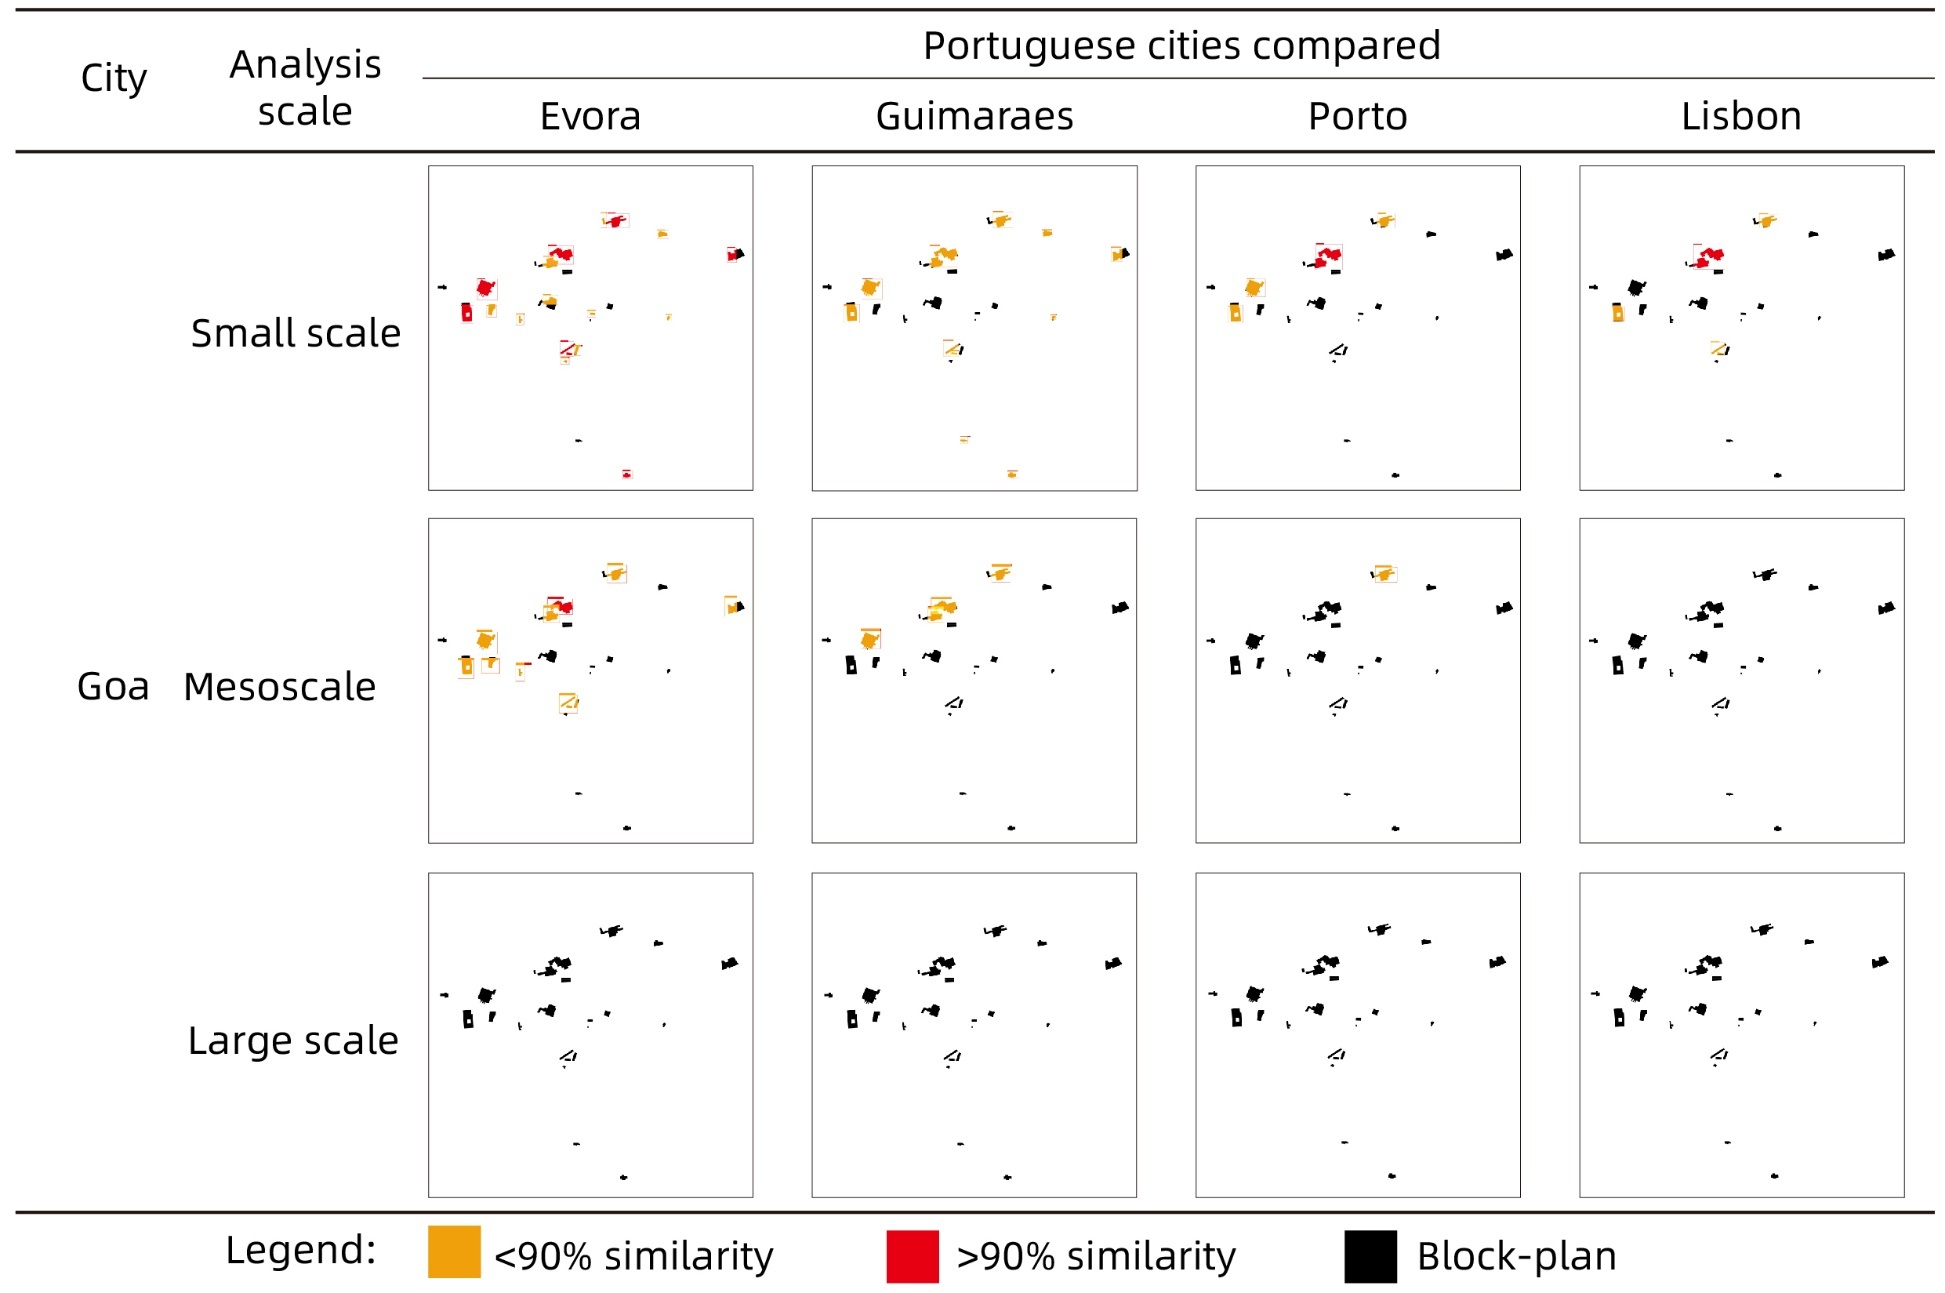
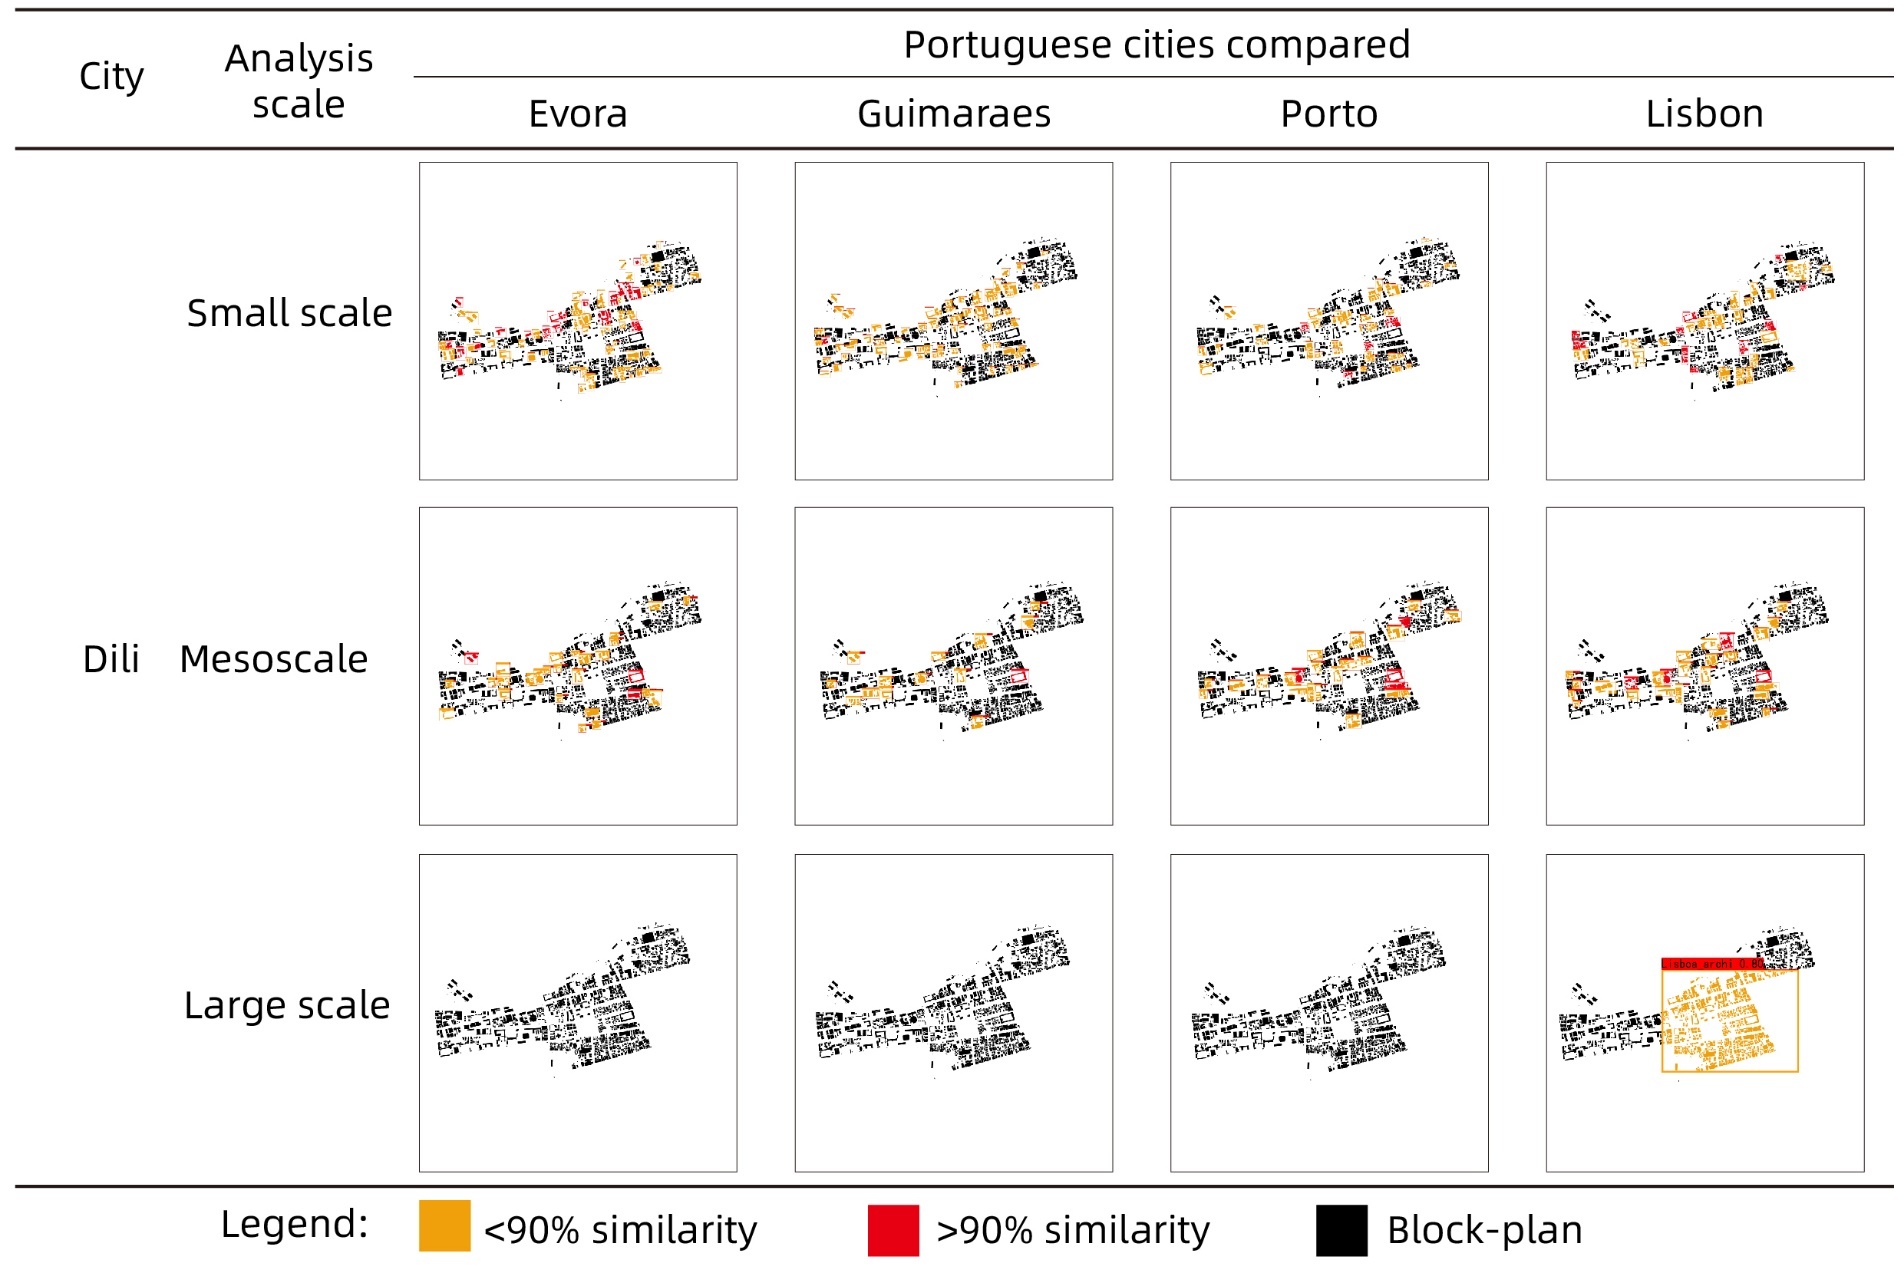
The red symbols in Figures 9, 11, 13, and 15 indicate similar areas that are more than 90% similar and heavily influenced by traditional Portuguese culture. An orange area indicates that there is 50%–89% similarity and that traditional Portuguese culture has had some influence on the area. However, with the construction and development of the city, some areas have destroyed the original urban texture, where black areas indicate that no similarity was detected. The similarity refers to the numerical results after the YOLO model analyzes the image based on the urban fabric characteristics, which is used to quantify the degree of matching between the image and the known urban fabric in the training set. This value is calculated by comparing the consistency between the features of the test image and the features stored in the model. The higher the value is, the better the image matches the urban texture.
3.2. Experiment result 1: comparison between Goa and Portuguese cities
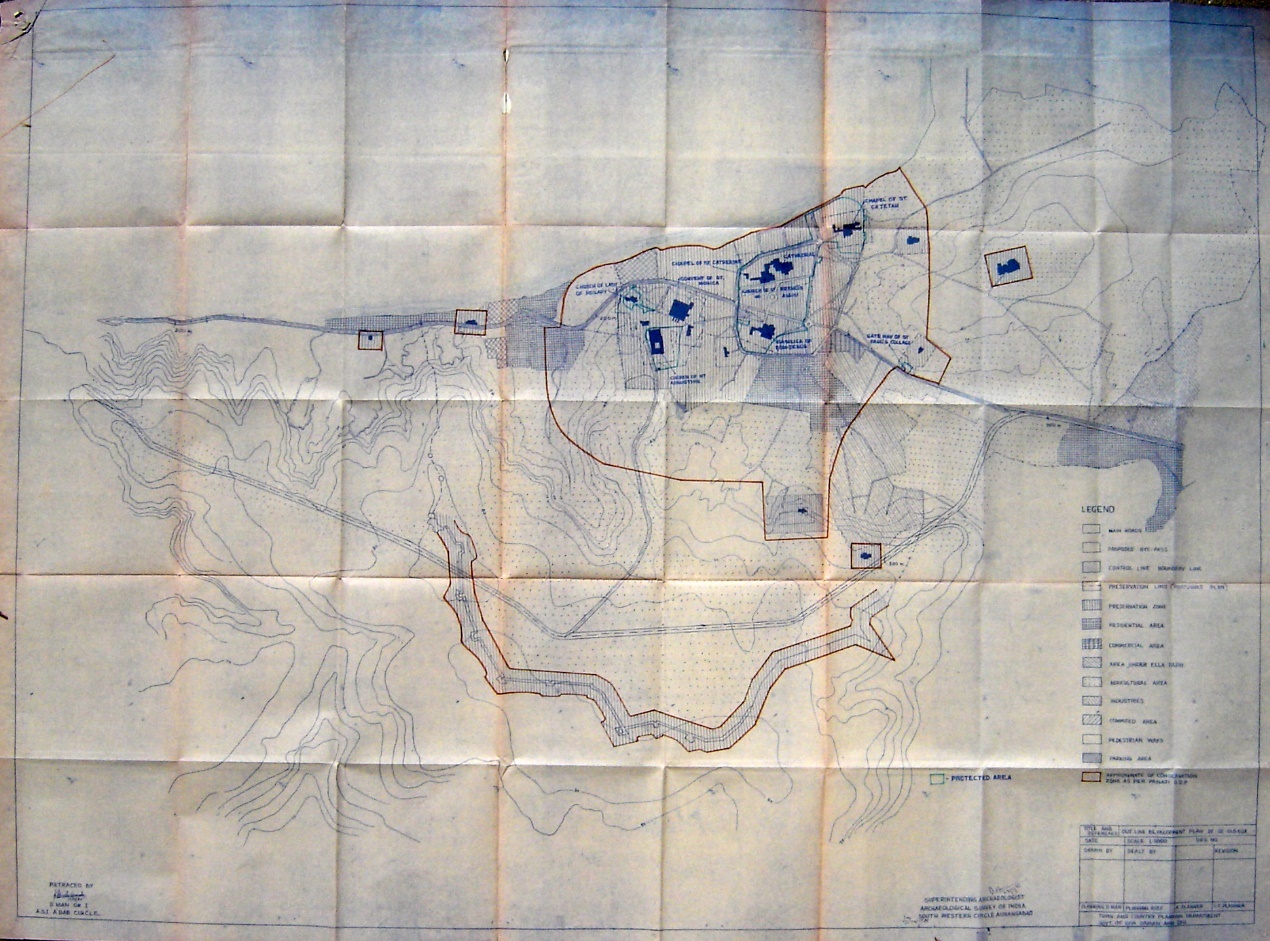
In 1498, Vasco da Gama first came to Goa, looking for a foothold in the trade route. Later, the Portuguese fleet arrived and occupied what is now the old city of Goa. In the 15th century, during the era of the Vijayanagara Dynasty and the Bahmani Sultanate, the Sultan’s palace, mosques, churches, and temples were built, and this area was listed as a World Heritage Site in 1986. According to the test results, on a small scale, Goa has the highest similarity with the three Portuguese cities of Évora, Porto, and Lisbon, and more than two regions show 90% similarity. At the mesoscale, Goa and Évora have the greatest similarity, followed by Guimaraes and Porto. At large scales, no similar urban morphological regions were detected (Figure 9). In terms of objective facts, most of the buildings preserved in the old city of Goa are single buildings (Figure 10), and the continuous texture of the historical urban area is less preserved. However, the historical urban areas of the four Portuguese cities all have traditional buildings that continue to be distributed, so Goa has the highest similarity detected only at a small scale.
3.3. Experiment result 2: comparison between Dili and Portuguese cities
The analysis results shown in Figure 11 show that at the small and mesoscales, Dili has high similarities with Lisbon, Porto, Évora, and Guimarães in Portugal, and there are many similar areas displayed by red marks. On a larger scale, the core port areas of Dili and Lisbon are also more than 50% similar. In the early days when Portugal ruled Asian cities, they not only engaged in the sandalwood trade but also exiled prisoners from Macau to Timor Island (mainly in the territory of today’s Timor-Leste). These prisoners were restricted from returning to Macau after they were released from prison, so they gradually settled in Timor-Leste and assimilated into the local society. Along with the people who immigrated to Timor Island, a local community was gradually established in Dili. Therefore, it is possible that part of Portugal’s “cultural genes” came to Macau along with the maritime trade and were then “rooted” in Dili through exchanges between Macau and Timor Island. The preserved historical buildings, such as the Tempo da Administracao Portuguesa, Palacio de Governo Timor Leste, Antigo Hospital Dr. António de Carvalho’s post office, and others, are also distributed along the port of Dili to the city center (Figure 12). Timor-Leste only became established as a country in 2002. It has confronted economic challenges and has been ranked 155th in the United Nations’ Human Development Index (United Nations Development Programme, 2024). Construction of modern buildings often depends on development assistance. This situation also leads the urban fabric of the Dili port area to retain its traditional style, which is consistent with the result of more than 50% similarity with Lisbon city on a large scale.

3.4. Experiment result 3: comparison between Macau and Portuguese cities
Figure 13 shows that at the small and mesoscales, Macau has a high degree of similarity with Lisbon, Porto, Évora, and Guimarães in Portugal, and many similar areas are shown in red. According to a large-scale comparison, the historical district centered on the Avenida de Almeida Ribeiro in Macau has more than 50% similarity with Évora. However, the similarity between the entire Macau Peninsula and Porto reaches more than 90%, and patches of similar areas are shown in red in Figure 13. It is speculated that at the time of Portuguese rule, Macau, an important port for maritime trade in the East, diverged from four international routes dominated by Portugal. The city was most influenced by Portuguese culture and the overall urban texture has a high degree of similarity with that of Portuguese cities. With the renewal of modern cities, the reorganization of old districts, and the construction of new land plots, some areas are inconsistent with the original urban texture. Therefore, the detection results at small and mesoscales appear in the form of multiple marked fragments.


3.5. Experiment result 4: comparison between Malacca and Portuguese cities
The analysis results shown in Figure 15 show that at the small and medium scales, Malacca has a high degree of similarity with Évora and Lisbon, and there are many red and orange marks. The area with the highest similarity to Porto shows the most areas marked in red. According to a large-scale comparison, the entire area of Malacca Island has more than 50% similarity with Évora, and there are patches with orange areas. Portuguese rule in Malacca (1511–1641) lasted only 130 years, which was not long compared to the Portuguese rule of Goa, Macau, and Dili. Later, the Kingdom of the Netherlands gradually took control of Malacca. The Portuguese promoted Malacca as a prosperous commercial port and established active sailing routes to Asian states such as China, Siam, and Myanmar, establishing close business relationships through trade. Ships from other countries, however, detoured around Malacca due to Portugal’s autocratic monopoly trade policy, including pirate-style forced port calls and harsh tariff policies (e.g., taxes, license fees, and port fees). These practices damaged Malacca’s status as an international port. Therefore, Malacca is less influenced by traditional Portuguese culture, and there are fewer Portuguese-style buildings preserved at present. There is only moderate similarity in urban texture, and even in the 18th century, the texture of large land parcels still remained the same in Malacca (Figure 16).


4. Discussion
4.1. Current model suitability and limitations
The research process revealed both advantages and disadvantages to the adaptability of the current model for urban morphology research. This study’s model primarily examines the urban form structure of island and port cities. The model’s specific geographical and historical background makes it effective in these cities. However, when applying this model to non-island and port cities, such as inland cities, the following aspects need to be considered:
(1) Geographical differences: Relative to island and port cities, inland cities have fundamentally different geographical environments. Water directly shapes the form of island and port cities, influencing the interaction between city and port, as well as the arrangement of docks, hotels, warehouses, forts, shipyards, wood mills, and other structures that support maritime trade. These factors are not present in inland cities. Topography and water availability nevertheless influence the development of inland cities, resulting in significant differences in urban layout and structure.
(2) Economic and cultural factors: Island and port cities often have robust international trade histories, and their economic activities closely align with international trade, thereby shaping their urban form. In contrast, inland cities may be more dependent on agriculture, industry, or other nontrade-related economic activities, which have very different impacts on urban form.
(3) Historical development path: Because of their geographical locations, island and port cities were often the focus of early colonial activities. This is true for the relationship between Portugal and Portuguese-speaking areas in this study. This historical background is less common in inland cities. As a result, the historical development path of inland cities may be quite different, necessitating detailed historical background analysis before model application.
(4) Model adjustment and parameter settings: Due to the above differences, the original model parameters and settings based on island and port cities may be unsuitable for inland cities. Effective migration and application of the model necessitate adjustments and optimizations, such as retraining datasets and adjusting algorithm parameters, are needed to ensure the model’s accuracy and applicability in the new environment. Applying this study’s model to inland cities necessitates taking into account a variety of geographical, economic, and cultural factors. Future work can explore how these factors specifically affect the migration and adaptation of the model through specific case studies, thereby developing more flexible and universal urban form analysis tools.
This study has several limitations. The study’s data source consists of map and spatial information and requires reliable information. If this information is unavailable due to local policies, a similar study may be difficult to conduct. This study compares the urban form perspectives of cities related to Portugal in the 16th and 17th centuries. This comparative analysis is mainly based on similarities in urban cultural development during the Portuguese Age of Discovery. However, if researchers were to compare two unrelated cities, the experimental results could be disappointing. Machine learning model training requires certain computer configurations, which may cause limitations in the device’s operating environment, making it difficult to carry out training experiments.
Although the YOLO model performs well in many respects, there are still some challenges and limitations to using this emerging technology in urban morphology research. Adaptability of new technologies: The YOLO model, as a relatively new technology, is still in its early stages of application in the field of urban morphology research. Therefore, models may have adaptability and stability issues when dealing with specific types of urban data. Sensitivity to complex urban environments: Despite YOLOv4’s advantages in processing complex images, identifying highly irregular or nonlinear features in cities may still present challenges, particularly in highly heterogeneous urban landscapes. Data quality dependence: The performance of YOLOv4 is highly dependent on training and test data quality. In urban morphology, high-quality, high-precision geospatial data are not always available, affecting model accuracy and reliability.
4.2. The potential of data-driven urban form analysis methods
The data-driven approach has valuable implications for urban historical research, particularly for historians’ work. Analyzing and extracting urban morphological units and areas not only improves research efficiency and accuracy but also provides new insights into the history of urban development.
This method has several potential future research uses: (1) History of urbanization: By comparing urban texture images from different periods, we can study how urbanization affects urban layout and social structure and impacts the lives of urban residents. (2) Transformation of cities before and after the Industrial Revolution: Urban morphology analysis can reveal changes in urban structure and spatial organization before and after the Industrial Revolution, especially in cities in the early stages of industrialization. (3) Impact of trade routes on urban development: Studies can examine how ancient trade routes such as the Silk Road and maritime trade routes shape urban form and development, especially in island cities, port cities, and trading centers. (4) Evolution of historical protected areas: Studies can explore how the urban fabric of historical areas and heritage sites can be preserved or changed using protection policies. (5) Socioeconomic development and urban expansion: Studies can examine how economic development, population growth, and social changes lead to changes in urban boundaries and how these factors shape the social geographies of cities.
In addition to macrolevel historical research, this approach may serve as an auxiliary analysis tool for urban development: (1) Time series analysis: Using sequence image data, historians can observe and analyze changes in urban texture in different historical stages, thereby providing a more accurate understanding of the role of time in urban development. (2) Complementary traditional methods: To enhance research diversity and depth, researchers can combine data-driven analysis with traditional historical research methods, such as by comparing machine learning results with historical documents and archival records. (3) Cultural heritage protection: A detailed understanding of urban morphology is helpful for cultural heritage protection and management, especially during urban renewal and planning, which can identify and protect urban areas with historical value. In addition to time and accuracy, other factors can be better considered through data-driven research methods. (4) Visualization of spatial relationships: Data-driven methods enable visualization of complex urban spatial relationships. This is crucial to understanding urban spatial structure and urban design principles.
5. Conclusions
This study uses machine learning to assist in comparison of typical Asian island and port city forms on the Maritime Silk Road as the main navigation route with Portugal in the 16th and 17th centuries. There is a strong correlation between the urban forms of the island and port cities and the trade history along the Maritime Silk Road. Among the four selected Portuguese cities, the comparison of recognition accuracy through machine learning revealed that Évora’s and Porto’s urban forms are more unique and localized, representing a greater extension of the traditional urban fabric. The overall urban form and texture of Lisbon are more abundant and diverse, and the contemporary urban form, texture, and conventional spatial development layout are more obvious. Among the four representative island and port cities in Asia, Macau has the highest degree of similarity with Portuguese cities according to a comparative analysis of the training model’s application. Dili and Malacca are next, and their routes and numbers of traded commodities were second only to those of Macau. The urban form of Goa is less similar to that of Portuguese cities, which may be related to the distance and frequency of maritime trade at that time. However, according to the results of the YOLOv4 algorithm, at a small scale, Goa has the highest similarity with the three Portuguese cities of Évora, Porto, and Lisbon, with more than two areas showing 90% similarity. In a large-scale comparison, the following three groups of urban forms all showed greater than 50% similarity: (a) Dili’s port core area and Lisbon; (b) Macau’s historical district centered on Avenida de Almeida Ribeiro and Évora; and (c) the whole of the island of Malacca and the city of Évora.
The method of using machine learning for urban morphology image recognition is not limited to the application of island and port cities in the Portuguese Age of Discovery in the 16th and 17th centuries discussed in this study. This study can provide a reference and inspiration for other related research fields. In the future, researchers could compare two or more cities in terms of maritime trade, the spread of religious beliefs, and other factors. For example, maritime trade starting from the coast of Fujian, China, passes through many island countries, such as Southeast Asia. Researchers could use the method described here to investigate whether the introduction of trade further influences urban forms. Similarly, the spread of faith allows for a comparison between identical temples and the urban texture layout of island countries. In addition to island cities and island countries, inland cities can also be subjected to comparisons and analyses of urban form based on the correlation between cultural integration and colonial historical background.
This study illustrates the potential of applying machine learning and YOLOv4 to the study of urban form. The analysis and extraction of urban morphological units and morphological regions can assist researchers in more quickly and accurately discovering results. Especially for historians, unlike the traditional method of spending a considerable amount of time searching for map information and comparing it with original documents, using object detection to compare digital urban fabrics can more quickly reveal similar areas between cities. This approach can help researchers quickly pinpoint historical districts that may have connections so that they can conduct more detailed analysis later.
Limited by technical conditions and time factors, target sampling and slice extraction still requires improvement, such as by increasing the number of samples and improving the slice resolution of urban form images.
Applying existing research methods to historical questions not only provides new insights into urban history but also promotes innovation in historical research methodologies. Additionally, by combining data-driven analysis with traditional research methods from other disciplines, such as archaeology, sociology, and economics, researchers can create a powerful tool for interdisciplinary research on historical issues.
Funding
This article is supported by the Science and Technology Development Fund (FDCT)'s Funding for innovation and Technology Promotion (0080/2023/ITP2).