
INTRODUCTION
The Mediterranean has historically served as a nexus for diverse cultures, geopolitical frameworks, and economic systems, thereby playing a significant role in interdisciplinary studies (Elez, 2015). The Adriatic Sea, as its most prominent basin extending into the Central European mainland, experienced significant socioeconomic transformations frequently influenced by broader geopolitical dynamics, leading to its characterisation as “the Mediterranean on a smaller scale” (Ivetić, 2019, p. 9) or “the Mediterranean within The Mediterranean” (Paronić, 2019, p. 499). Fernand Braudel, for example states that it is “perhaps the most unified of all the regions of the [Mediterranean] sea,” and that “it provides material for all the problems implied in a study of the Mediterranean as a whole” (Braudel, 1972, p. 125). In the early modern period, the principal political entities that exerted influence over the area were the Republic of Venice, the Ottoman Empire, the Habsburg Monarchy, the Papal States, the Kingdom of Naples, and military insignificant but economically relevant small Republic of Ragusa (Chaline et al., 2001; Ivetić, 2019).
The Adriatic Sea basin contains more than fifteen hundred islands, islets, and rocks that have functioned as habitats, socioeconomic resources, hubs for maritime trade, safe havens during storms or attacks, and important strategic and military locations (Čuka & Faričić, 2020). In order for those activities to be feasible and navigation among the islands to be effective and safe, the islands or their certain geographical features have historically served sailors as important terrestrial landmarks crucial for navigation, as evidenced by their regular presence on old nautical charts and geographical maps produced during the early modern period. In addition, many islands, especially those situated along established shipping routes, were recorded in portolans (portolani); navigational books providing distances and bearings between important coastal features, serving as precursors to modern-day rutters (Steinberg, 2005), and were further documented in greater detail in isolarios (isolarii), a publishing genre of the early modern period that integrated historical and geographical descriptions of islands and coastal areas with their cartographic depictions (Faričić et al., 2020; Stouraiti, 2013; Tolias, 2007).
Old charts and maps are imagery that, besides illustrating territorial outlines, encompass numerous layers of geographical and historical information, making them valuable for research purposes and esteemed for their aesthetic qualities (Pickles, 2004). According to Denis Cosgrove (2012), they are functional, operating elements that shape the environment and our social, political, and spatial frameworks. Similarly, the cartographic depictions of islands are intricate representations that transcend mere geometric appearances (Cosgrove, 2012). The perception of islands as distinct geographical entities is significantly influenced by the cartographer’s geographical knowledge, the available mapmaking techniques, and the degree of generalisation, which is constrained by the dimensions of the carrier material and the map scale. Consequently, the cartographer’s “vision” of the island’s representation on old nautical charts and geographical maps becomes a pivotal factor a posteriori, as it influences and instils the mental image of the specific island among map users. Paul Carter (2009) contends that although cartographic depictions of coastlines may possess empirical validity to some degree, they, in fact, serve as generalised graphical representations that often appear in “similitudes” due to cartographers’ inductive reasoning aimed at “bringing order to the landscape of the world” (Carter, 2009, p. 50). He asserted that coastal regions, which were either partially or entirely unfamiliar to cartographers, were likely represented through generalisations derived from other cartographic sources. The cartographer aimed to connect the capes, significant for their geomorphological relevance and navigational utility, while depicting the intervening coasts—considered less critical—as sketches of a series of bays, thereby imparting an aesthetic distinctiveness to the charts (Carter, 2009). However, the sketchy coastlines on nautical charts were typically rendered in a highly stylised manner, failing to accurately depict the actual appearance of coastal features, indicating that the visual representations of islands were also “metaphysical abstractions” (Steinberg, 2005, p. 258).
Alongside graphical elements, geographical names constitute the fundamental content of charts and maps. The robust cognitive link between language and spatial perception enables them to serve as carriers of concise linguistic markers that effectively substitute lengthy descriptions of locations, as they are already mentally embedded within them (Reszegi, 2020). Except for their orientational function, geographical names are also identity carriers and monuments of their socioeconomical and historical backgrounds. It means regions with a rich historical heritage and cultural interactions, like the Adriatic Sea, possess numerous sites abundant in geographical names and their variations (Faričić, 2007, 2009, 2013, 2016).
The visual representations of islands on old charts and maps, including their shape and visual exaggeration, along with their geographical names—considering whether the islands were labelled and the nature of their cartographic annotations—can clarify their function as a medium of communication with users and their potential applications. While early modern charts and maps serve as significant sources of spatial information, communication media, and at least partially as effective navigational tools, their historical reliability may be compromised by various limitations, necessitating careful professional scrutiny.
SCOPE, SAMPLE, AND METHODOLOGY
Although the graphical representation of islands and the inscription of their names on charts and maps constitute distinct layers of spatial information from the phenomenological standpoint, as the complexity of their coastlines and their essential geographical features collectively form a more intricate assemblage of spatial data, they functionally complement one another by aiding in the identification of geographical features, indicating their relative spatial significance, and augmenting the overall geographical understanding of the region. Moreover, a cartographer may be aware of the existence of an island but be unfamiliar with its name and may choose to graphically represent it without labelling it. In another scenario, the cartographer might know the island by a specific name in a particular area, but lack precise information about its location and dimensions, leading to the decision not to include it on the map. Consequently, although a convincing quantitative correlation and causal relationship between the manifestation and distribution of those map elements cannot be determined, their significant utilitarian connection and interdependence warrant a thorough and partially quantifiable examination of the matter. This study examines the depiction of Adriatic Sea islands on early modern nautical charts and geographical maps from two perspectives. The first perspective pertains to their positioning and visual appearance, focusing primarily on the coastline’s configuration and the islands’ sizes in relation to their true shapes and the map scales of the examined old charts and maps. The second perspective pertains to geographical names of these islands, particularly regarding their designation and the reliability of their cartographic denotation.
A comprehensive analysis of all the distinctive features of the Adriatic Sea’s islands as represented in the early modern cartography overall exceeds the conventional journal article framework. One reason is that early modern charts and maps derive their historical continuity of Adriatic representations on maps from classical antiquity (Dilke, 1985), through medieval mappaemundi (Woodward, 1987) and portolan charts (Campbell, 1987; Pujades i Battaler, 2007, 2023), with their corpus significantly expanding due to the invention and dissemination of printing (Faričić & Marelić, 2025). The other reason is that it comprises more than fifteen hundred islands, islets, and reefs, predominantly situated near its eastern coastline, including densely clustered formations of smaller units like those found in the Venetian Lagoon in contemporary Italy or the Kornati archipelago in modern Croatia. Accurate mapping of such island groupings was unattainable prior to the implementation of systematic geodetic and hydrographic surveys for the creation of large-scale topographic maps and nautical charts in the early nineteenth century (Altić, 2021; Faričić & Mirošević, 2016; Kozličić, 2006). The aforementioned reasons also hinder the formulation of precise quantitative criteria for the selection of islands and old maps for the study. Therefore, a cartographic sample was arbitrarily chosen from a broader array of early modern nautical charts and geographical maps, deemed sufficiently representative from a phenomenological perspective by the authors, while the selection of islands is fundamentally conditioned by their location, size, and navigational significance.
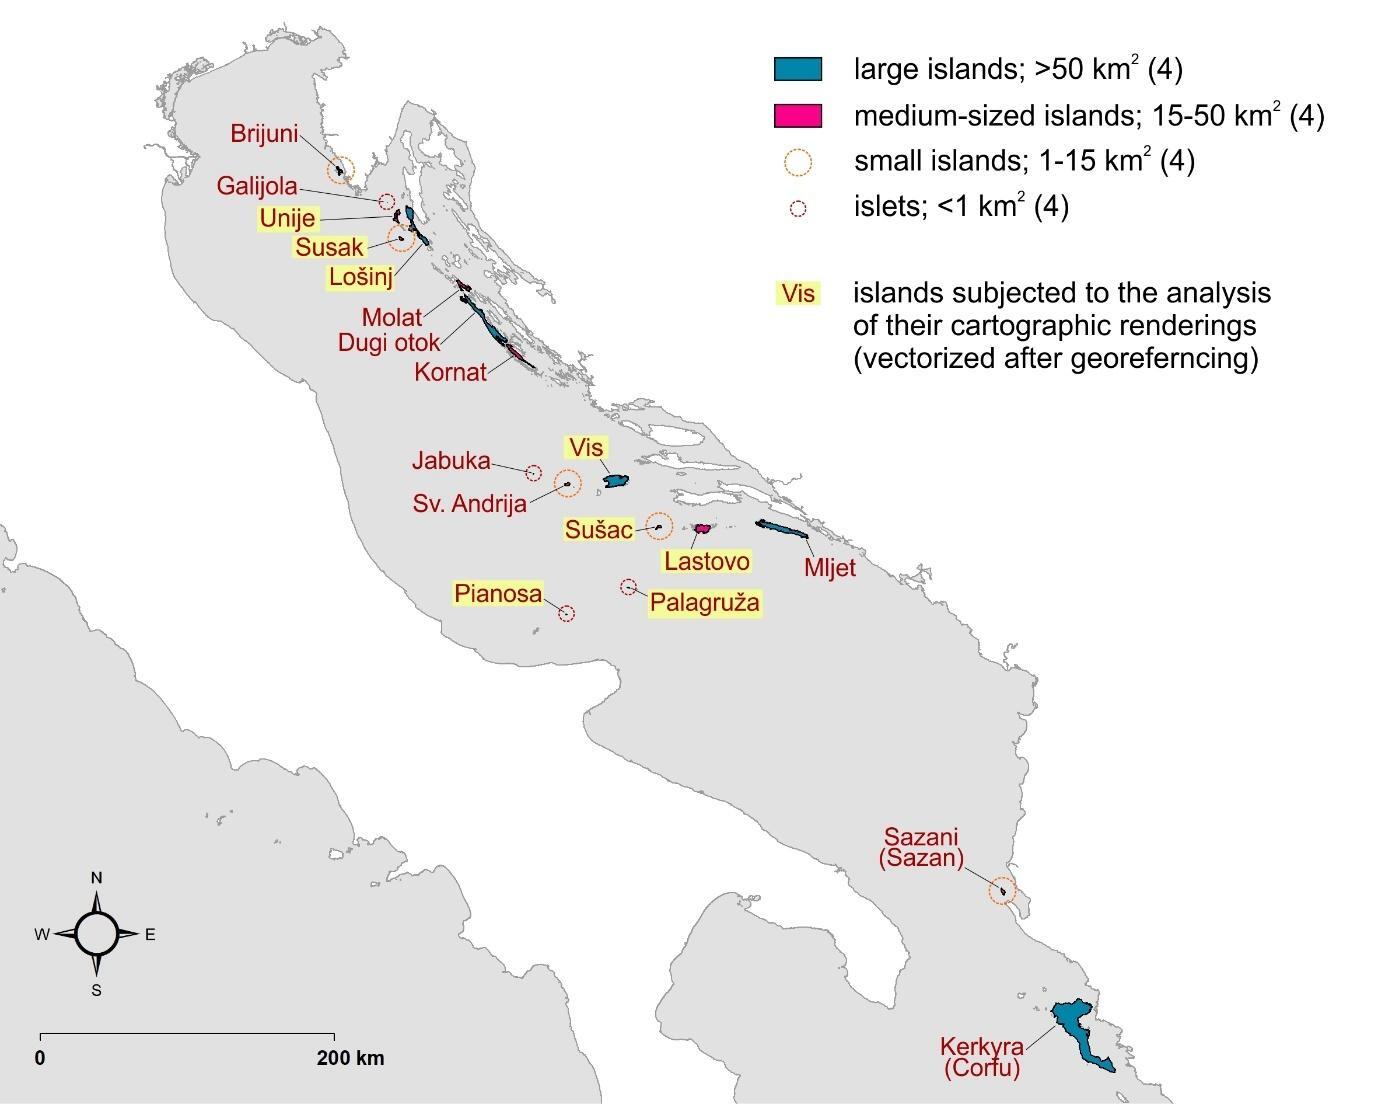
The sample of eighteen islands was chosen for the study based on their relatively uniform geographical distribution and historical significance for open sea navigation. Thus, the chosen islands are situated either entirely in the open sea or constitute the outer island perimeter of the eastern Adriatic coastline (Figure 1). The exceptions are Brijuni, a small archipelago frequently represented as a single island on old maps, and Corfu, predominantly situated in the Ionian Sea (IHO, 1953), owing to its historical importance since antiquity. The Republic of Venice, which acquired it in 1204, designated it as The Gateway to the Adriatic, while the Venetian cartographer Vincenzo Maria Coronelli described Corfu as the “Gate of this Sea, Forehead of Italy, and Bastion of Christianity” (Coronelli, 1694, p. 38). Islands were further classified based on their area employing Ratimir Zimmerman’s classification of Croatian islands, enhanced by the framework proposed by Tea Duplančić Leder et al. (Zimmerman, 1997; Duplančić Leder et al., 2004), as Zimmerman’s classification fails to recognise islands (islets) smaller than 1 km² as a separate category: (a) large islands (> 50 km2): Dugi otok, Mljet, Lošinj, Vis, Corfu; (b) medium sized islands (15-50 km2): Molat, Kornat, Unije, Lastovo, Sazan; (c) small islands (1-15 km2): Brijuni, Sveti Andrija, Susak, Sušac; (d) islets (<1 km2): Galijula, Jabuka, Palagruža, Pianosa.

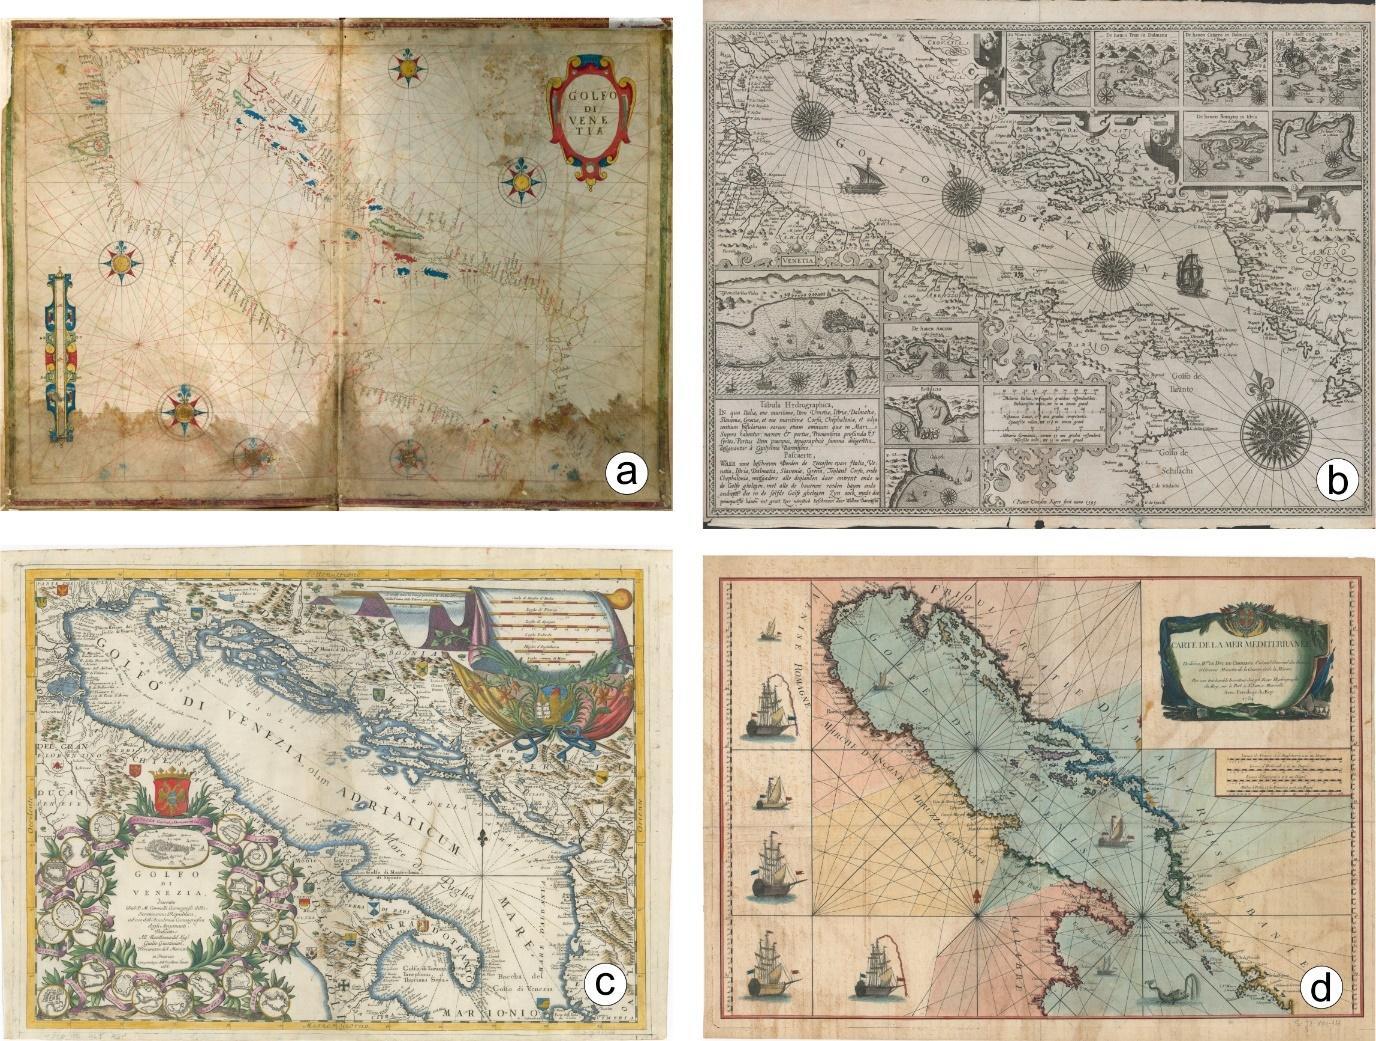
The cartographic sample comprises a total of sixteen digital reproductions, encompassing twelve nautical charts and four geographical maps created between 1538 and 1784 (Table 1, Figure 2). The nautical charts are, in addition, categorised into three sub-groups, each containing four charts: manuscript (portolan) charts, printed charts without graticule, and printed charts with graticule. All sixteen charts and maps were utilised for the study of toponyms, with half of them—two units per category—subjected to cartometric analysis to assess the graphical representations of islands. Additionally, the island sample was divided in half for this purpose, resulting in the selection of eight islands, that is, two from each area classification. Given that nautical charts primarily emphasise maritime regions and the coastlines of the mainland and islands, only one quarter of the sample comprises geographical maps.

Visual appearances of the selected eight islands—Unije, Susak, Lošinj, Vis, Sušac, Lastovo, Palagruža, and Pianosa—were analysed in GIS software by comparing their images on six nautical charts and two geographical maps with their appearance on a modern (reference) map in the shapefile format. All charts and maps were georeferenced to their best-fit projection of the reference map (Marelić, 2025a; Nicolai, 2014; Penzkofer, 2016), utilising 45 control points per unit and employing Helmert similarity two-dimensional transformation (Modenov & Parkhomenko, 1965) to preserve their original geometry. Two manuscript portolan charts and two printed maps without graticule were georeferenced using a purely geometrical approach, whereas two nautical charts with graticules and two geographical maps were georeferenced using coordinates extracted from them, which were properly longitudinally shifted in advance and utilised as their pseudo-reference points. In Marelić (2025a), the procedure itself is explained in greater detail.
Five of the six nautical charts exhibited the highest geometric similarities when compared to the Mercator projection. Giacomo Gastaldi’s geographical map is geometry-wise most similar to equidistant conic projection with standard parallel φ0=36° (a modern approximation of Ptolemy’s First projection), while Van der Aa’s 1720 nautical chart and Vincenzo Maria Coronelli’s geographical map from 1688 showed geometric best-fit in comparison with normal equidistant cylindrical projection with standard parallel φ0=36°. After georeferencing, all eight charts and maps were reprojected into HTRS96/TM projection, on which the distortions of distances and areas for the Adriatic Sea are minimised (Lapaine & Tutić, 2007), and the coastlines of the selected eight islands were manually vectorised, that is, converted into shapefile features, enabling area and perimeter geometry calculations.
To calculate the values of individual linear exaggeration or attenuation for each island’s coastline representation, a metric labelled as the Local Map Scale Index (LMSI) was utilised. The linear discrepancies on a relative scale between the island’s image on the old map and its contemporary equivalent, both adjusted to a 1:1 ratio, are assessed. To obtain the metric, the area of each specific island [km2] must be calculated from both the old and contemporary maps. Subsequently, it is (conditionally) assumed that these areas correspond to the dimensions of imaginary circles, whose diameters [km] are also computed. The final outcome, represented by the LMSI metric, is the ratio of the diameter of the imaginary circle denoting the island on the old map to the diameter of the imaginary circle representing the same island on a modern reference map. The circle was selected as a substitute simple two-dimensional shape due to its uniform linear dimensions in all directions, effectively eliminating discrepancies in the visual representation of islands across various maps at the linear level, which in some instances were substantial (Figure 4, Table 2). The majority of the analysed charts and maps were initially supplied with linear map scales, which were utilised to calculate their approximate map scales (Table 1). For those lacking linear scales, their approximate map scale was determined by comparing the measured distances with their real-world equivalents.
ISLAND POSITIONING AND VISUAL APPEARANCES
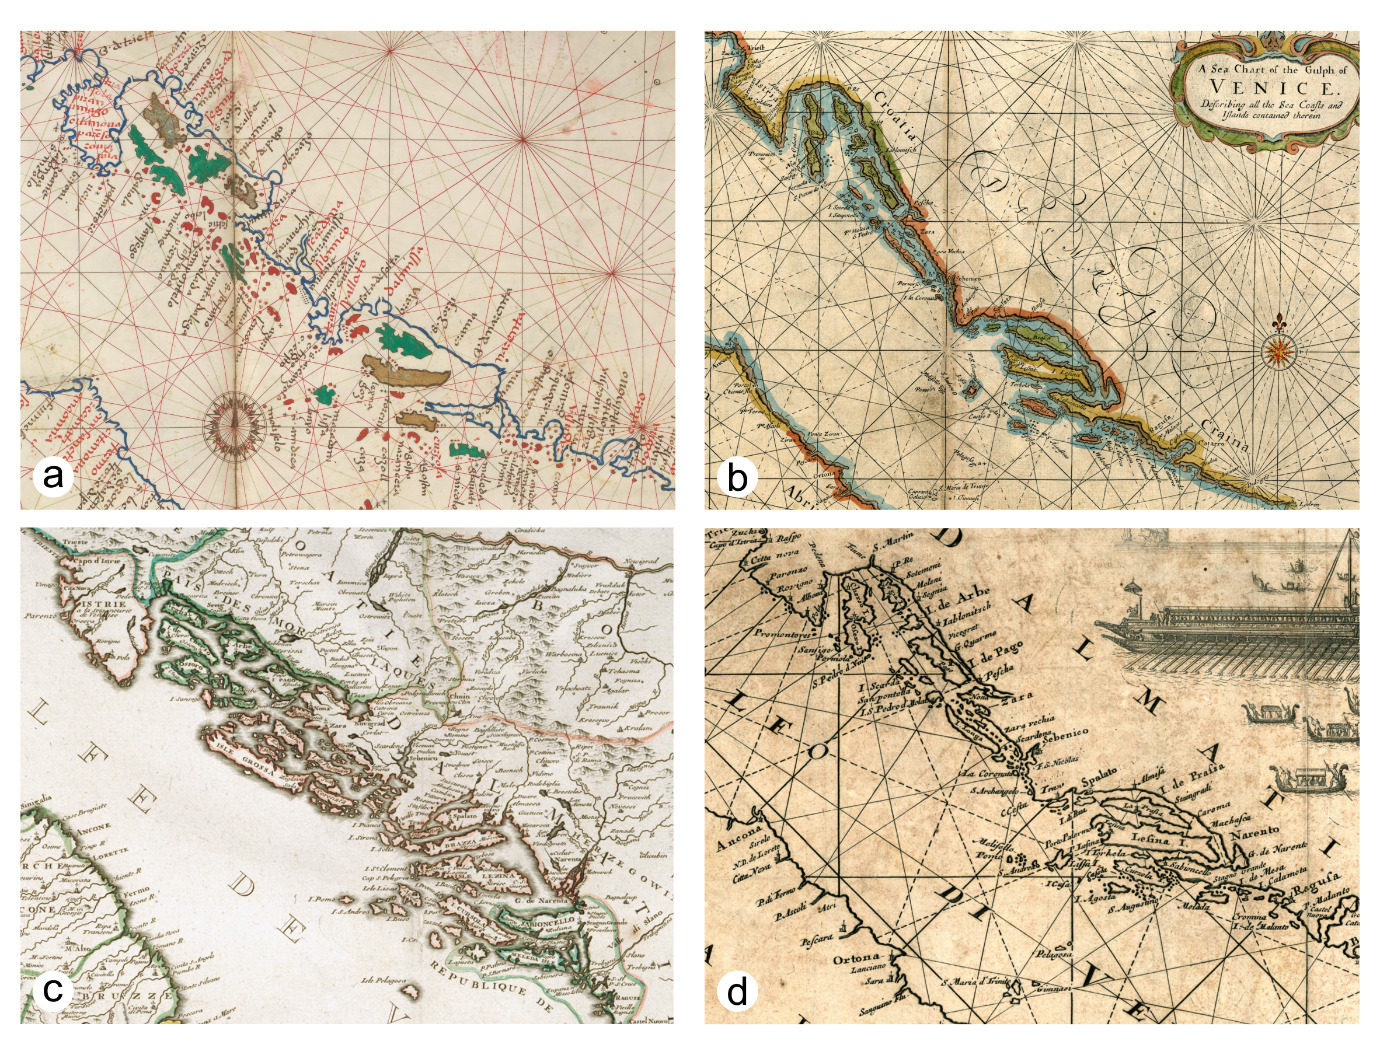
While the Adriatic Sea and some of its islands were depicted on more complex mediaeval mappae mundi, which emphasised the Christian symbolic conception of the “old world” (Pujades i Battaler, 2023; Woodward, 1987), the first highly realistic cartographic representation of the region emerged in the late thirteenth century with the advent of portolan charts, the earliest known nautical charts that typically show the Mediterranean and Black Seas, and the Atlantic coasts of Europe and Northwest Africa. Their most significant characteristics include web-like networks of straight colour-coded lines (the so-called rhumb lines) radiating from their centres in 32 directions (later supplemented with ornamented illustrations of compasses, known as compass roses), the usage of linear scale bars, and the perpendicular inscriptions of toponyms relative to coastlines (Campbell, 1987; Pujades i Battaler, 2007, 2023). The display of coastline contours on portolan charts was sketchy and typically illustrated as a series of arcs, resembling a jagged, saw-tooth configuration (see the upper-left part of Figure 2 and Figure 3). Their production continued throughout the early modern period, occasionally manifesting as portolan atlases featuring smaller-extent charts. However, the overall image of the charted area surprisingly remained largely unchanged (Marelić, 2024, 2025b; Nicolai, 2014).
The rediscovery of Claudius Ptolemy’s geographical treatise, originally written in the second century BCE, had a significant impact on Western European cartography during the Renaissance. Its most significant feature, aside from using a “mellower” graphic style to illustrate coastlines, is that it adopted the idea of assigning spherical coordinates to locations (Berggren & Jones, 2000; Gautier Dalché, 2007). Consequently, early modern geographical maps and nautical charts became deliberately made using map projections and usually incorporated graticules of latitudes and longitudes (Faričić & Marelić, 2025), despite the fact that the invention of the chronometer, which allowed for accurate field observation of longitudes, occurred much later, in the eighteenth century (Taylor, 1948). During that time, cartographers were largely influenced by Ptolemy’s geographical data to create their geographical maps, maintaining his notable longitudinal exaggeration, while those producing nautical charts with graticules presumably inferred longitudes from the graphical representation of coastlines on portolan charts (Marelić, 2023b, 2023a).
Systematic field surveys of the Adriatic Sea were initiated in the early nineteenth century. The first hydrographic surveys, albeit partial and restricted to several localised extents, were conducted in 1806 and 1808–1809 under the supervision of French hydrographer and cartographer Charles François Beautemps-Beaupré (Kozličić, 2006). The first complete hydrographic survey was performed by the joint team of Austrian, Neapolitan and British specialists in 1818 and 1819, culminating in a composite nautical chart comprising 20 sheets, titled Carta di cabottaggio del Mare Adriatico, published by Military-geographical institute in Milan (then in the Kingdom of Lombardy–Venetia as part of the Austrian Empire) in 1822 and 1824 (Faričić & Mirošević, 2016). Subsequently, from 1866 to 1873, a hydrographic survey led by joint Austrian and Italian teams produced four courses nautical charts made to a larger scale and fifty-five coastal charts made to a smaller scale (Altić, 2021). Prior to that period, early modern cartographers predominantly depended on trial-and-error attempts, with their works largely derived from earlier-made charts and maps, descriptions and field reports made by sailors, merchants, military officers and state, provincial and local officials, and travelogues of pilgrims and other travellers (Faričić & Marelić, 2025).
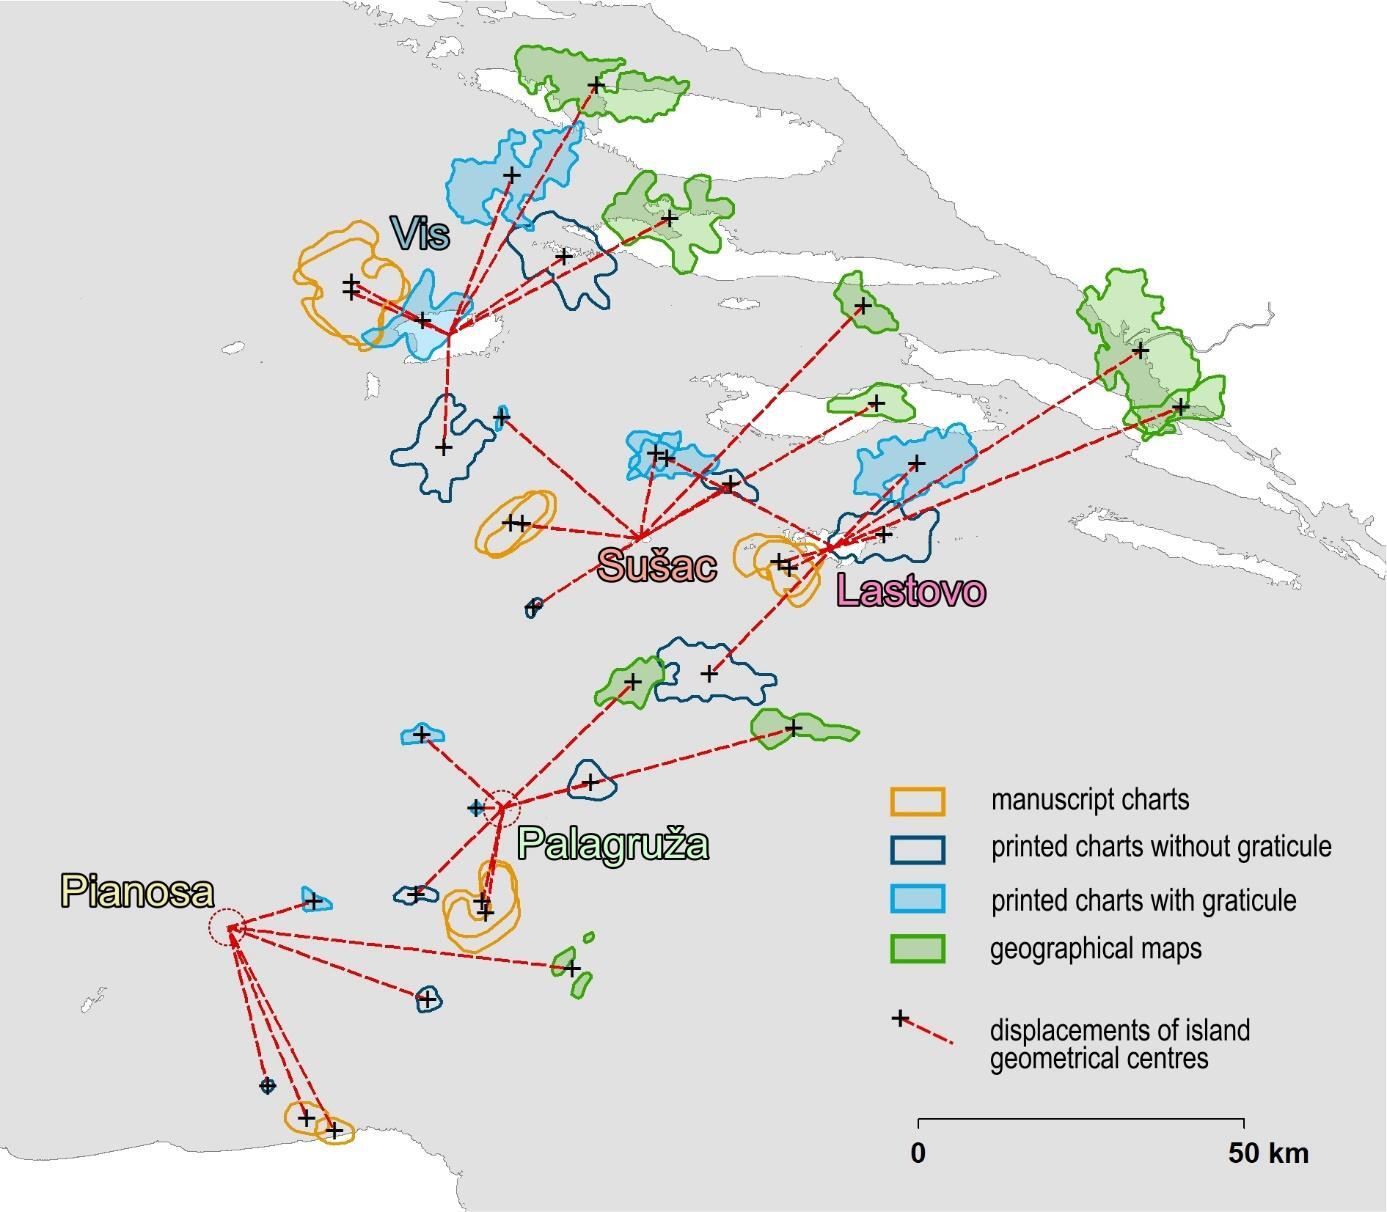
_battista_agnese_s_manuscript_portolan_chart_from_1538_(source__uni.png)
The ways in which these technological limitations negatively impacted the cartographic representations of the Adriatic islands during the early modern period are more apparent when comparing the outlines of their images on georeferenced old charts and maps to their appearance on a modern map (Figure 4). First, the shapes of the same island are inconsistent across various charts and maps, and their overall shapes do not correspond to their actual appearance. This suggests that their shapes are more likely the result of the subjective assessment of the cartographer who drew them than the collection of tangible spatial data, either directly by the author or through intermediaries. Second, errors in mapping the position of islands generally vary among different authors and different types of maps. Exceptions are the portolan charts of Battista Agnese and Marchetto Fassoi, which exhibit nearly identical shapes and positions of selected Adriatic islands, but this is not unexpected, as portolan charts often demonstrate a significant degree of resemblance since their content was typically copied from one chart to another using several techniques (Krtalić, 2022; Marelić, 2020, 2024). Printed nautical charts without graticules, which were also graphically georeferenced in this study, show greater displacement errors compared to portolan charts, indicating a decrease in the planimetric accuracy of the representation of the Adriatic islands in the early modern period; a characteristic that is not only applicable to islands, but also to the entire Adriatic coastline (Marelić, 2023b). Third, there are significant differences in the positional mapping errors of islands between nautical charts and geographical maps that were georeferenced using their coordinates as pseudo-reference points, with islands on geographical maps showing larger longitudinal errors, primarily due to the previously mentioned reliance on Ptolemy’s coordinates. For example, the longitudinal displacements of the islands of Lastovo and Palagruža on Coronelli’s geographical map from 1688 are 55.9 km and 27.7 km, respectively, while Pieter Van der Aa’s printed nautical chart from 1720 indicates longitudinal displacements of 29.0 km and 16.7 km, respectively. Fourth, in numerous cases, the islands were mapped noticeably larger compared to their size on a modern map. This feature, primarily linked to portolan charts but also characteristic of other old charts and maps, is quantifiable and examined in greater detail in the subsequent section.
Local Changes in Map Scale
In strict adherence to present-day standards for nautical chart creation regarding map scale, islets and certain small islands should have been completely excluded from early modern charts and maps made to an average scale of about 1:1,800,000 (Table 1). An island with an area of 1 km² is reduced to 1 mm² on a map with a scale of 1:1,000,000, thereby making the accurate representation of islets like Palagruža (0.3 km²) and Pianosa (0.1 km²) impossible. However, numerous islands, despite being small, were not only consistently portrayed on nautical charts since their emergence in the late thirteenth century, but their cartographic representations were also typically made disproportionately large.
The scholarly perspectives on the causes of such exaggerations are not uniform. Scott A. Loomer posits that the cartographers’ meticulous understanding of the coastline’s appearance accounts for their representations (Loomer, 1987), whereas Jonathan T. Lanman contends that they depicted the coastline without necessitating a detailed portrayal, although they may have had a superior comprehension of its actual morphology (Lanman, 1987). When examined without quantitative analysis, the most rational explanation for the highlighting of specific coastal features in such a way appears to be their enhanced navigational significance relative to the surrounding charted region; a perspective endorsed by Sir Charles R. Beazley (1904) and Tony Campbell (1987), and akin to that of F. Braudel (1972), who regarded islands as more crucial for navigation than commonly acknowledged, because they served as navigational landmarks and safe havens for sailors. Based on the authors’ knowledge, the only two attempts to demonstrate these exaggerations quantitatively are Roel Nicolai’s (2014) and Tome Marelić’s (2020) doctoral theses. They examined only portolan charts and assert that the exaggerations correspond to about 5 to 10 kilometres in reality (Nicolai, 2014), with more remote islands being visually exaggerated to a greater extent (Marelić, 2020) to facilitate object recognition for terrestrial navigation.

The research findings indicate that smaller islands were mapped with greater exaggeration. The islets of Palagruža and Pianosa exhibited average Local Map Scale Index (LMSI) values of 10.6 and 9.0. Conversely, larger islands like Lošinj and Vis, with areas of 74.37 km² and 89.72 km² respectively, were (linearly) enlarged by factors of 1.9 and 1.3 (see Table 2). However, Palagruža and Pianosa are not just small islands; they are also exceedingly distant from the mainland. Palagruža, being the most remote island in the Adriatic, lies approximately 44 km from Sušac, 60 km from Lastovo, 70 km from Vis, and 56 km from the town of Vieste on Cape Gargano, while Pianosa is somewhat closer to the western coast of the Adriatic and is about 52 km from Vieste. This means that the disproportionately large representation of smaller islands can be attributed not only to their size but also to their distance from the coast; the more remote the islands, the more significant their role as crucial terrestrial landmarks during open sea navigation, especially if they are small and thus difficult to observe from afar. Given that all analysed charts were created at a significantly smaller map scale than contemporary nautical charts produced by national hydrographic offices for navigational purposes, it is reasonable to infer that smaller islands were depicted at a relatively larger scale to alert navigators about their presence. This reasoning could explain a single instance of the reduced depiction of the island of Unije on three nautical charts and one geographical map, while the neighbouring Susak was rendered as enlarged in every instance. Unije (16.9 km²) is significantly larger than Susak (3.8 km²), with its highest peak (Kalik; 138 m), surpassing that of Susak (Garba; 98 m), thereby enhancing its visibility from a vessel. This indicates that it was more important to exaggerate the cartographic representation of Susak, simultaneously compromising the portrayal of Unije. Furthermore, due to the absence of spatial measurements and the knowledge of the actual dimensions of the islands at that time, the cartographers were likely unaware that they had inadvertently diminished the representation of Unije on the map.
The study also demonstrates that the islands were portrayed as enlarged not only on nautical charts but also on geographical maps. Although local map scale exaggerations of islands are most pronounced on manuscript portolan charts, which exhibit an average LMSI of approximately 5, subsequently produced printed charts, irrespective of the presence of a graticule, demonstrate LMSI values that are twice smaller (see Table 2). Their predominantly uniform index values can be attributed to the prevailing copying practices of the era, as numerous printed charts seem to be derivatives of the Dutch cartographic template created by Willem Barentsz in 1595 and subsequently reproduced by various others, including John Seller and Pieter Van der Aa, whose charts were examined in this study (Faričić & Marelić, 2025; compare Figure 2 and Figure 3). In contrast, the representations of islands on the examined geographical maps are considerably more magnified, exhibiting LMSI values of 4.3 and 4.1. This may be attributed to the non-navigational characteristics of geographical maps, prompting their authors, who lacked accurate spatial data, to rely on rudimentary information about the islands and imprecise notions of their locations, thereby prioritising an overall cartographic balance that is aesthetically pleasing.
ISLAND TOPONYMS
Geographical names (toponyms) are essential for spatial identification, orientation, and navigation, while also conveying symbolic meanings that reflect the cultural and political motives of those who assign them (Orth, 1987). They shape social space by assigning labels to places and embedding them with associated ideas and images (Jordan, 2009). Toponyms serve as the “lifeblood” of nautical charts due to their navigational support, particularly when utilised in conjunction with nautical pilots (Astengo, 2007). Old maps are valuable because they not only record geographic names but also helped spread their use. In his introduction on mapping meaning, Denis Cosgrove (1999) notes that the spread of geographical names through maps may become detached from the original intent of the decision-maker or mapmaker who selected them. For example, by designating the entire Adriatic Sea as the “Venetian Gulf,” French, Spanish, Dutch, and English cartographers were not necessarily endorsing the Venetian political narrative; rather, in using Venetian charts and maps of the Adriatic as templates from which they uncritically reproduced geographical content, they also adopted the Venetian name Golfo di Venezia for this part of the Mediterranean (Faričić et al., 2023).
The study of toponyms offers valuable insights for comparing nautical charts and aids in identifying patterns of advancement or decline in chart design that are not readily apparent through superficial observation (Campbell, 1987). Nonetheless, a significant number of early modern charts and maps were created without substantial modifications, often leading to the uncritical replication of toponyms, whose validity was consequently perpetuated over time, despite the inaccuracies of the annotations associated with specific locations (Faričić, 2007). A notable feature of late medieval and early modern manuscript portolan charts was the use of red ink to denote significant locations such as ports, capes, and islands, while the remaining toponyms were inscribed in black ink (Campbell, 1987; Pujades i Battaler, 2007, 2023). Another characteristic was the aforementioned perpendicular orientation of place names to the coastline, necessitating the rotation of charts to fully comprehend their geographical information. Furthermore, the toponyms associated with islands were inscribed as rotated by 180° relative to the toponyms pertaining to adjacent locations on the mainland. The exceptions included the names of islands situated near the mainland (e.g., Rab – Arbe, and Pag – Pago) that, in a sequential arrangement, constitute the innermost row of islands. The names of these islands are inscribed in the same orientation as the names of geographical features on the mainland, thereby complicating their differentiation from annotations pertaining to nearby mainland locations. However, with the advent of printed nautical charts, this practice was discontinued, and the names of specific locations were inscribed in black and oriented horizontally (Nordenskiöld, 1897). The cartographer’s choice to assign a geographical name to a particular island seems to have been chiefly guided by his (subjective) assessment of the island’s importance, the spatial limitations of the chart or map (considering physical dimensions, map scale, and the density of geographical information to be incorporated), and the absence of a standardised approach to map generalisation during the early modern era. The islands of seemingly lesser navigational significance and those situated within dense island clusters were more prone to remain unlabelled.
The eastern coast of the Adriatic, predominantly part of modern Croatia, is naturally associated with most of its names on nautical charts and geographical maps (see Table 3), as the rest of its coastline is comparatively barren of nearby islands. The notable exception is its northernmost region between Ravenna and Trieste, which comprises numerous densely clustered lagoon islands formed by sediment inflow from adjacent rivers such as the Po, Adige, Piave, Tilment, and Isonzo. Despite the fact that sailors had to sail past them with caution to avoid running aground on the shallow sandy seabed, the toponyms of these islands were rarely listed on nautical charts, unlike certain remote small islands situated at its centre, like Palagruža and Pianosa, which were typically designated with toponyms. This characteristic can be attributed to practical reasons; all linked to their physical dimensions and relatively small map scale. The initial point is that these constraints inherently prevent the inscription of place names for a significant number of closely grouped units, whereas the small, isolated open-sea islands in the Adriatic offer ample space on the chart for their names to be incorporated. The second point is that the Venetian navigators, who consistently navigated those lagoon areas for centuries, developed intricate cognitive maps adequate for terrestrial navigation, and they believed that such information should be kept confidential from political and other adversaries. This assumption was put forward by Giacomo Marieni, one of the protagonists of the first systematic field survey of the Adriatic Sea, conducted in 1818 and 1819. In his Portolano del Mare Adriatico, a comprehensively detailed nautical pilot published the Military-Geographic Institute in Milan in 1830, he wrote:
The Venetians, who along with their well-known success, have dominated the Adriatic for several centuries, for some reason, whether because the times were like that, or perhaps because of the doubtful character of the Republic, which is not for us to judge, never considered producing nautical charts of their shores, which are so desired by all sailors who have gained experience in other seas and know they can make sailing more pleasant, safe, and quick. (Marieni, 1830, p. VI)
Overall, this study shows that geographical names were assigned to approximately one-fifth of the total islands depicted on a chart or map, with a comparable number of near (inner) and outer islands receiving toponyms in most instances (see Table 4). The analysis of selected charts and maps revealed that not all Adriatic islands were designated with toponyms, including even some larger ones. This omission is understandable considering the scale and dimensions of old charts and maps, which often rendered the inscription of geographical names impractical or entirely unfeasible. The criteria for labelling islands in the early modern period lacked the standardisation typically employed in contemporary cartography; it primarily depended on the availability of relevant spatial data, the perceived navigational importance of an island, and the space available for the insertion of the toponym. The naming of eastern Adriatic islands illustrates this phenomenon, as they are predominantly organised in parallel chains that align with the coastline’s geomorphological characteristics; the outer islands, which face the open sea, were more frequently named irrespective of their size, while the nearby islands, some of which are among the largest in the Adriatic, were generally left unnamed. Toponyms could not be inscribed for these nearby islands as they would have conflicted with the names of settlements and ports on the adjacent mainland.
The analysis of island toponyms across the examined charts and maps indicates that the toponymic variations for each island are generally minimal, with the different name variations being quite similar to one another. The majority of geographical names on the analysed charts and maps are either directly or indirectly attributed to the Venetian cartographers who served the Venetian Republic, the sovereign entity that dominated most of the Adriatic Sea region during that period. Direct naming pertains to charts and maps created by Venetian cartographers, whereas indirect naming pertains to charts and maps produced by cartographers from other nations, yet significantly influenced by Venetian cartographers (Faričić et al., 2023). The largest island depicted on maps and nautical charts of the Adriatic Sea is Corfu, located between the Adriatic and Ionian seas and encompassing an area of 610.9 km². During the early modern period, it was predominantly referred to by its Venetian name, Corfu, rather than its Greek designation, Kerkyra (Κέρκυρα), which was also utilised by various non-Venetian cartographers. This led to the adoption of the Venetian name across various European languages, such as English Corfu, Spanish Corfú, French Corfou, Dutch Corfu, and Croatian Krf. The name Corfu serves as an exonym in various languages, denoting a geographical name utilised solely outside the region inhabited by the native group or language community, whereas the Greek designation is employed exclusively within Greece as an endonym, referring to a geographical name used by the native group or language community itself. The Venetian names of the islands depicted on charts and maps are primarily derived from modifications of their ancient Latin names, which have persisted for centuries despite their transformation into łengua vèneta, that is, Venetian language (later considered as one of the idioms of the Italian language). In the era of the Roman Empire, the nomenclature of the Adriatic Sea islands was typically derived from either original Latin designations or Latinized adaptations of pre-existing Greek, Histrian, Liburnian, or Illyrian names (Šimunović, 2005; Skok, 1950). The nomenclature of the islands depicted on early modern charts and maps of the Adriatic Sea, along with their variations, fails to represent the linguistic diversity and ethnic attributes of the present-day inhabitants of those islands. The initial cartographic endeavours to document locally utilised toponyms were undertaken only in the early nineteenth century, coinciding with the production of the topographic maps, first detailed large-scale maps produced by state-governed cartographic offices. These maps featured precise representations of various minor geographical features and objects, whose names were unfamiliar to the Venetian administration at the time. Consequently, cartographers predominantly opted to forge (new) Venetian idioms of the Croatian, Albanian, and Greek names utilised by the local populace for generations, despite some exceptions. The local community of the smallest inhabited island in the Dubrovnik archipelago, known as Elaphites, refers to it as Kalamota (derived from the Venetian name Calamota; Skok, 1950), rather than its standardised Croatian name, Koločep. An additional example is the designation Sansegoti, a local name of the population of the island of Susak, which has Venetian origins (derived from the Venetian name for the island Sansego; Hraste et al., 1956), although the correct form in Croatian would be Suščani. In the Italian language, the Venetian variants of the geographical names of the islands are still predominantly utilised today, whereas the geographical names employed by the Croats, Montenegrins, Albanians, and Greeks for their islands are infrequently used. This is partially due to the depiction of the Adriatic islands on early modern maps and nautical charts, which significantly contributed to the dissemination of geographical information that subsequently became entrenched in the Italian language.
Notable Aspects of Naming Certain Islands
In most instances, all four analysed large islands had their toponyms inscribed nearby, with a few exceptions: the labels for Lošinj and Dugi Otok were absent on Battista Agnese’s chart (1538), and Lošinj was not referenced on Voltius’s chart (1593). In almost every instance, at least one toponym, denoting a settlement or a specific localised area, was employed as the name for the entire island.
The study of the toponymy of the island of Kornat (see Figure 1), which is the largest island of the Kornati archipelago and part of the medium-sized Adriatic islands, indicates that the authors of manuscript portolan charts frequently depicted an additional distinct island, designating it as toret(t)a. The name Toreta designates a site called Tarac on the island of Kornat, which features an early medieval fort (tureta) (Faričić, 2013) and a fertile agricultural area, historically esteemed due to the predominantly arid karst landscape of the rest of the island. The cartographers were likely aware of Toreta fort’s existence, as they frequently included an intuitive cartographic symbol near the inscription (Kozličić, 1995). On most printed charts, the island of Kornat is designated, but the inscription is predominantly positioned further southeast, nearer to the depiction that ostensibly represents the island of Žirje. Despite the frequent misplacement of its inscription, the island of Kornat was predominantly identified, likely due to its considerable size and navigational significance. Between the island of Kornat and the island of Dugi otok lies a small island named Katina, situated amidst two straits: Proversa vela and Proversa mala, with the former being both broader and deeper, thereby accommodating larger vessels. The historically recognised “gap” between the two elongated islands was commonly utilised by sailors as a shortcut when navigating to and from the city of Zadar (an important harbour and administrative centre of the entire Dalmatia) from the open sea. The inscription pertaining to the strait (e.g., Prouesa, Prouerso, Preversa), indicative of its navigational significance, appears on various old charts and maps (Figure 5). The toponymy of other medium-sized islands indicates not only that fewer of them have been named on charts and maps, and their locations exhibit positional inaccuracies; for instance, none of the islands from the selected sample were named on Ortelius’s 1590 map. The island of Lastovo (Lagosta) was the most represented. Furthermore, there exists a notable instance of “cartographic doubling,” wherein a single island is represented as two adjacent islands, a phenomenon arising from the uncritical replication of earlier cartographic sources. Close to the island of Molat (Melada), cartographers frequently depicted another island called Zapontello; however, in actuality, Zapontello (Zapuntel), Melada (Molat), and Brgulje are the names of three settlements located on the island of Molat, with the Molat settlement being the biggest among them (Figure 5). An explicit illustration of the territorial possession of the island by a political entity is evident in Coronelli’s 1688 map, where the inscription regarding the island of Lastovo states: I Lagusta, ò Agosta de Ragusi, and on Bellin’s 1771 chart on which it states I Agosta de Raguse, indicating that the island was, at the time, under the jurisdiction of the Republic of Dubrovnik; the island of Sušac is marked in the same manner.
Within the examined sample of small islands, small archipelago Brijuni was occasionally devoid of toponyms, in contrast to the other small islands, which were named considerably more often. For instance, the islands of Susak, Sveti Andrija, and Sušac were omitted only by Ortelius on his 1590 map. In two instances (Seller 1677 and Van der Aa 1720), the island of Sveti Andrija was erroneously referred to as Melisello, a designation that actually pertains to a small island of Jabuka (typically referred to as Pomo), situated approximately 23 kilometres to the northwest. This occurrence exemplifies the fluidity of toponyms, although it does not always reflect accurate information. In various charts and maps, it appears that the toponym Melisello has not been utilised since the middle of the eighteenth century.
Besides the island of Palagruža, which is referenced on all examined charts and maps, the island of Jabuka is the next most frequently mentioned islet, absent only from Ortelius’s 1590 map. The other two islets analysed⎯Galijula and Pianosa⎯were less frequently represented. Both islands were omitted from three maps. Additionally, Pianosa is absent from two charts and Galijula from four, likely due to its diminutive size.

CONCLUSION
According to contemporary standards, there are considerable inaccuracies in the locations, shapes, sizes, and toponyms of Adriatic Sea islands on early modern nautical charts and geographical maps, but these limitations are primarily a consequence of the technological constraints faced by cartographers in performing accurate field observations and their accustomed production of relatively small-scale cartographic products. This study has shown that the representation of islands on these maps is layered and diverse, not only between different types of old maps, but also depending on the island’s position, size, and navigational importance.
The analysis of the island’s visual representation on those charts and maps provides several advancements and findings in the academic discourse surrounding this topic. The methodological advancement is a proposed procedure for the exact numerical determination of individual island portrayals based on the Local Map Scale Index (LMSI), which can be implemented following the georeferencing of the old maps in accordance with their specific geometric properties. The positioning of islands and their graphical representations vary not only across nautical charts and geographical maps but also among various subtypes of nautical charts. Geographical maps exhibit the substantial positional displacements of islands, primarily influenced by the Ptolemaic perspective adopted by their authors, whereas nautical charts, irrespective of the presence of graticules, appear to be more accurate in this regard. Furthermore, substantial increases in local map scale were observed in manuscript portolan charts and geographical maps, unlike contemporary printed nautical charts, which often conformed to the uniform replication of the same Adriatic cartographic model derived from Dutch cartography. Research also indicates that, regardless of the map type, more remote and smaller islands, such as Palagruža and Pianosa, which are significant for terrestrial navigation, were portrayed with a higher degree of visual exaggeration than larger islands situated nearer to the mainland.
Not all Adriatic islands illustrated on the analysed charts and maps were designated with their names, signifying that the level of generalisation concerning geographical names exceeded that utilised for the graphical depiction of the islands. The primary reason is the insufficient space on small-scale maps, combined with the necessity to emphasise only those islands relevant to terrestrial navigation, irrespective of their actual dimensions. Even the smallest of the remote islands, such as Palagruža and Pianosa, were consistently designated by name, while larger islands situated near the mainland, like Ugljan, Pašman, and Brač, were frequently left unnamed, presumably to avoid conflicts with the toponyms of nearby coastal features, primarily cities. Among the documented toponyms, Venetian variants were predominant, indicating the prevalent use of the Venetian language among Mediterranean mariners and the wide dissemination of Venetian charts as significant communicative tools. Other European cartographers adopted Venetian geographical names by replicating the geographical content of Venetian charts and maps of the Adriatic. These charts and maps illustrate that names commonly used across Europe have endured as exonyms in various European languages, substituting the indigenous names of Adriatic islands in everyday discourse (e.g., the English Corfu instead of the Greek Kerkyra).
Funding
This research is a part of the scientific project IP-2020-02-5339 Early Modern Nautical Charts of the Adriatic Sea: Information Sources, Navigation Means, and Communication Media (NACHAS), supported by the Croatian Science Foundation (HrZZ).