
1. Introduction
In Italy, islands are among those territories at higher risk of marginality and geographic peripherality. If peripherality equates to spatial remoteness—a typical feature of insularity—marginality goes beyond the mere geographical location of an area in relation to central service or resource hubs. Marginality relates to reduced access to essential services, poor socio-economic performance, and challenges like depopulation and aging populations. And, if coupled with insularity, it further worsens the disadvantages faced by island regions.
The condition of insularity presents great variability. The literature on insularity has highlighted several dimensions of first-nature geography that exacerbate it (Armstrong & Read, 1995; Borgatti, 2008; Gillis, 2004), emphasizing how the burden of being an island is shaped by both geographic and governmental factors (Licio & Pinna, 2021). Remoteness is one such dimension, as it inherently limits accessibility and economic integration. Marginality, on the other hand, is more closely associated with what is known in the literature as second-nature geography, referring to human-made infrastructure and policy interventions that influence spatial development and connectivity.
This work examines the within-dimension of an island, focusing on accessibility and travel times. Accessibility and travel times are two sides of the same coin. Accessibility is a broader concept that describes how easily people, goods, and services can reach a destination. It encompasses factors such as infrastructure quality, the availability of public transport, and travel costs. Travel times, instead, serve as a quantitative measure of accessibility, indicating how long it takes to move from one place to another. They act as a proxy for transportation costs and play a key role in determining market potential. An area may have low accessibility not only due to long travel times but also because of inadequate public services or poor infrastructure. The novelty of this paper lies in its focus on within-island accessibility and travel times.
Typically, islands are analyzed as homogeneous entities, emphasizing their insularity relative to the mainland, without considering the internal disparities that exist within them. If being an island entails higher costs than mainland territories, insularity’s effects do not impact all locations equally. Coastal areas differ from central regions, especially on large islands with challenging geography, low population density, and poor infrastructure endowment. In this context, being surrounded by water adds an additional challenge on top of another factor: being located in an inner area. Similarly, smaller islands under the administrative jurisdiction of larger islands exhibit marked differences compared to the inland or coastal areas of the latter. In Italy, the two major islands, Sicily and Sardinia, each administer several smaller islands within their respective jurisdictions. The peripheral location and maritime separation of these minor islands create additional barriers to mobility, trade, and service provision, even when they fall under the same administrative framework. These islands typically face severe constraints in transportation infrastructure and connectivity, resulting in longer travel times, higher costs of access to essential services and markets, and reduced economic integration. In these terms, insularity encompasses heterogeneous realities: coastal areas, central regions, and smaller islands.
Large islands—often corresponding to regions or even countries—are characterized by diverse spatial configurations and distinct center–periphery dynamics. Their infrastructure is often inadequate, largely due to the high costs of maritime and air transport, communication, and construction, driven by natural and climatic constraints, limited availability of usable land, and barriers to accessing education and healthcare services (Garau et al., 2019).
Recently, Italy developed the National Strategy for Inner Areas (SNAI), a public policy designed to protect and promote those territories characterized by low accessibility, reduced opportunities, and declining populations. These territories correspond to inner peripheral areas—a concept central to European policy in the 1980s and 1990s—and, generally, they lag behind in economic performance, development, access to essential services, and quality of life compared to their neighboring territories (ESPON, 2018). The concept of “inner” or “inland” is broader, as it also encompasses all municipalities facing similar challenges and disadvantages as central territories; municipalities on smaller islands are fully considered inner peripheral or ultra-peripheral areas.
The SNAI is closely tied to geography. Italy is a challenging territory, with the Alpine and Apennine mountain ranges and a landscape that is 35% mountainous. According to the SNAI, these mountainous areas host the highest concentration of remote inland regions, characterized by peripheral or ultra-peripheral municipalities. Another major challenge is Italy’s insularity: islands account for nearly 17% of the national territory, and many municipalities in Sicily and Sardinia are classified as peripheral or ultra-peripheral. However, the specific challenge of intra-island remoteness is often overlooked.
We take advantage of the SNAI classification to examine inner areas in Italy’s two main islands, Sicily and Sardinia, aiming to examine within-island marginality and peripherality. The objective is to provide a picture of the heterogeneity of the large islands’ realities, encompassing coastal zones, inland and mountainous regions, as well as adjacent small satellite islands. Indeed, one of the key traits of marginality and peripherality is limited accessibility and the reduced opportunities available to the inhabitants of inner areas. We focus on these characteristics by analyzing travel times from municipalities (Local Administrative Units - LAU) to cities, urban centers providing essential services such as healthcare, education, and transport, as well as to the transport infrastructure that allows residents to move within the island, to the major island, and to the mainland.
The analysis of municipal accessibility in Sicily and Sardinia reveals notable differences. A significant proportion of Sicilian municipalities is classified as “peripheral” (40.3%), and Sardinia stands out with 13.5% of “ultra-peripheral” municipalities. In terms of travel times, nearly 35% of towns in both islands take over 40 minutes to reach their reference municipality, but only 6 municipalities in Sicily exceed 90 minutes, compared to 26 in Sardinia. Furthermore, the eastern region of Sardinia faces the longest travel times, with 32 municipalities requiring over an hour and a half to access a large city, whereas most areas in Sicily maintain more favorable conditions, with 34% of municipalities having travel times between 30 and 45 minutes. The differences extend to transportation infrastructure, as Sardinia lacks motorways and has longer travel times to railway stations and airports, particularly in its central and eastern regions. Overall, while both islands face challenges in accessibility, Sardinia exhibits a slightly more pronounced struggle, particularly in its eastern municipalities, underscoring the need for targeted interventions to enhance connectivity and service access.
The paper is structured as follows. Section 2 reviews the literature. Section 3 introduces the data and methodology. Section 4 presents and discusses the results, utilizing maps for visualization. Finally, section 5 concludes.
2. Literature review
The economic literature on islands began to emerge in the 1990s, a decade in which research on the vulnerability of Small Island Developing States (SIDS), island development, economic growth, costs, disadvantages of insularity, and sustainable tourism gained significant impetus. A part of the literature has focused on the concept of islandness—the potential of an island—all those characteristics that have been turned into a strength. Another part of the literature has focused on the concept of insularity, meaning the measurable characteristics of islands, which usually entail a cost.
The literature on insularity has highlighted several factors that exacerbate it. Armstrong and Read (1995), Briguglio (1995), and Spilanis et al. (2003) focus on size: being surrounded by water and being small represents a condition of disadvantage. Gillis (2004) and Borgatti (2008) consider remoteness and its relationship with distance in the context of insularity. The concept is close to the peripheral one. The dispersion of the territory in many islands, like archipelagos, is a further characteristic of insularity, referred to as “double insularity” (Haase & Maier, 2021), implying higher production costs, larger public sector, and shortage of skilled labor.
Vulnerability is another trait that the literature on insularity has emphasized. According to Briguglio (1995) and Atkins et al. (2000), the greater exposure to exogenous shocks, like environmental and weather phenomena, makes islands vulnerable, affecting their economies.
As Licio and Pinna (2021) suggest, there is a cost difference between being an island and having islands, and differences occur across islands. The mere fact of being an island does not necessarily entail a large cost; it is instead being an island plus certain characteristics that make the cost of insularity larger. They find that the higher cost of insularity is borne by those islands that are remote, small, and dispersed. Licio and Pinna (2021) use these characteristics to compute a composite insularity index and measure insularity for all countries in the world, whether they are countries with islands or island-states.
Also, the government of a territory has its burden. Licio and Pinna (2021) distinguish between autonomous states and islands dependent on larger countries and find that island-states without sovereignty face the greatest disadvantage associated with the insularity condition. Indeed, small-island nations and other sub-national island jurisdictions (SNIJs), non-sovereign territories, have been specifically targeted by international programs and special measures, highlighting the inadequacy of addressing insularity solely at the national level.
More recently, the concept of island remoteness and vulnerability has been used to analyze the spread of COVID-19 during the pandemic, highlighting the benefits of isolation and the significant impact on economies primarily reliant on tourism. The sea served as both a barrier and a protective shield, as some islands managed to remain COVID-free for extended periods (Baldacchino & Starc, 2021). However, once the islands restored connectivity with the mainland to revive tourism, the gap in infection rates between the islands and the mainland steadily narrowed. In many cases, islands even recorded higher infection rates than their mainland counterparts (Licio & Pinna, 2021).
While research on islands has explored various aspects of insularity and the associated costs, less attention has been given to the internal differences within islands. The assumption that the condition of insularity and its associated disadvantages are uniform across an entire island can be quite strong, especially in the case of large islands. Therefore, within an island, some areas may be more affected by insularity than others, with higher costs and greater isolation, remoteness, and distances.
Internal remoteness and marginality are features discussed in recent literature, not exclusively focused on islands. The terms remoteness, peripherality, and geographic marginality have sometimes been used interchangeably, and their meanings have not always been clearly distinguished. On the one hand, peripherality has been associated with first-nature geography, linking it to rugged terrain, remoteness, long distances, borders, isolation, insularity, an unfavorable climate, or the lack of natural resources (Tsiotas & Tselios, 2023). On the other hand, peripherality has also been understood beyond geographical factors, incorporating elements such as low population density, income levels, educational attainment, and limited accessibility, or to measure and analyze regional disparities (Crescenzi, 2005; Rodriguez-Pose, 2013, 2020; Tsiotas & Tselios, 2022). In this sense, peripherality is often synonymous with marginality, which is more closely related to economic, social, and institutional factors (Storti et al., 2022a, 2022b; Tsiotas & Tselios, 2022).
Marginality has been highly debated in the economic geography and regional science literature. Usually, marginal areas are those in the periphery of regions. In these terms, peripherality leads to marginality, and this creates a vicious cycle, as marginality is linked to reduced investment in transport infrastructure (Tsiotas & Tselios, 2023), which in turn further limits accessibility, mobility (Karampela et al., 2015), efficiency, innovation, and knowledge transfer (Bergantino et al., 2013; Bergantino & Goetz, 2013). The literature also highlights how marginality is linked to the lack of connections with the country’s economic and productive structure (Harjunen et al., 2021; Marucci et al., 2020).
Within this literature, the concept of geographical marginality in Italy has been specifically examined, mainly referring to the National Strategy for Inner Areas (SNAI), which addresses and seeks to mitigate these challenges. Indeed, Gallo and Pagliacci (2020) find that rurality and Inner Areas influence the unequal distribution on gross income in Italy. Compagnucci and Morettini (2024) discuss the identification of functional areas and the definition of peripherality. Vendemmia et al. (2021) propose an alternative classification of marginal areas based on mobility, demographic, and socioeconomic indicators, highlighting that the SNAI classification underestimates the fragility of some areas. Marucci et al. (2020) evaluate the process of marginalization in Italian municipalities by using specific criteria to identify intervention priorities and enhance public policy planning for the development of marginal areas. Their findings indicate that marginal municipalities are concentrated in specific geographic regions of Italy and emphasize the need for an equity-based approach to assessment.
3. Methodology and Data
We aim to present a comprehensive analysis of within-island accessibility, using detailed data on accessibility and travel times for all municipalities located on the two largest islands in the Mediterranean Sea. The analysis covers 767 municipalities, representing over 10% of the entire Italian population. For each municipality, we present estimated travel times to the nearest city, to the center providing essential services, and to key transport infrastructure, enabling connections within the island, to the main island (for municipalities located on smaller satellite islands), and to the mainland. We focus on the spatial distribution and patterns of accessibility, adopting a descriptive approach at the most granular administrative level available to capture the heterogeneous accessibility conditions observed on large islands. We further discuss the results on accessibility and travel times in light of the daily commuting patterns of residents, focusing on the share of inhabitants who travel outside their municipality for work or study.
Our analysis draws from three primary Istat data sources. Table 1 outlines the variables employed in the analysis, providing their definitions and sources.
To estimate travel times to cities, we use a detailed dataset of origin-destination matrices (Matrici delle distanze), which measure distances in kilometers and travel times in minutes between all Italian municipalities using a private vehicle. This dataset, processed using Geographic Information Systems (GIS) tools and a commercial road graph, maps out 7,903 municipalities as of January 1, 2021. The matrices integrate updated geographic and traffic data from the 2020 TomTom road graph, which reflects real-world traffic conditions, road characteristics, and factors like congestion, traffic signals, and other potential delays. Travel times were recorded on October 2, 2020, at 8:30 AM, a peak urban commuting hour, and were calculated using the Dijkstra algorithm, which minimizes total travel distances. For municipalities on smaller islands, travel times account for the multimodal connections necessary to reach the main island. These are calculated by combining car travel times to the nearest port in the minor island with ferry travel times to the corresponding port on the main island. The data includes variable speed profiles that reflect different traffic speeds throughout the day, providing a realistic view of travel conditions. We combine this dataset with 2021 Census data (Censimento permanente della popolazione e delle abitazioni), focusing on cities with at least 50,000 inhabitants.
Our second data source is the Composite Fragility Index (Indice di Fragilità Comunale, IFC), a summary measure that identifies municipalities most exposed to certain risk factors, facilitating analysis of territorial fragility over time. The index is built from twelve indicators representing key territorial, environmental, and socio-economic dimensions of fragility. We use the index of accessibility to essential services, which measures how remote a territory is from centers offering three crucial services (education, health, and mobility) as defined by the Istat’s Map of Inner Areas (Mappa delle Aree Interne) and the National Strategy for Inner Areas (SNAI). The indicator reflects the average road travel time using a private vehicle between the center of a municipality (identified by the centroid of the census section where the town hall is located) and the corresponding center of the nearest Core or inter-municipal Core. For municipalities located on smaller islands, travel times also account for ferry services or other public transport connections required to access the main island. The Core or inter-municipal Core municipalities are identified based on the availability of all three essential services: a hospital with an emergency department; a complete cycle of upper secondary schools (at least one classical or scientific high school and at least one technical or vocational institute); and a railway station with active passenger service, at least of “Silver” category (i.e., a medium-small train station). Other municipalities are represented according to their distance from these Cores in terms of actual travel times, classifying them into four categories of increasing relative distance: belt, intermediate, peripheral, and ultra-peripheral. This classification highlights the potential disadvantages in accessing services for those farther away. Travel times to these service providers refer to 2019.
The third data source focuses on municipal accessibility to key transportation infrastructure. Through an agreement between Istat and the Management Authority of the PON “Governance and Institutional Capacity 2014-2020,” Istat has developed new statistical indicators at the municipal level regarding accessibility to infrastructure nodes for road, rail, sea, and air transport networks (Accessibilità dei comuni alle principali infrastrutture di trasporto). Accessibility is generally measured by the ease of reaching a given destination, which is calculated based on the distance or travel time between the origin and destination. This dataset covers the administrative geography as of January 1, 2021, and includes 7,903 municipalities. It tracks access to 258 railway stations (with active passenger services, including long-distance trains), 2,842 highway access points, 35 commercial airports, and 54 ports with passenger traffic. Distances are measured in travel times using the TomTom road graph, and we rely on the “Cost to Closest” index, which calculates the minimum time needed to reach one of these key infrastructure points from any given origin in 2022. Travel times are measured in minutes, calculated by car using a private vehicle, or by ferry, in the case of municipalities located on smaller islands.
Commuting patterns complement the analysis of accessibility and travel times. Mobility data, sourced from Istat and referring to 2019, capture daily movements for study or work purposes outside the municipality of residence. These data are collected as part of the Permanent Census of Population and Housing (Censimento permanente della popolazione e delle abitazioni).
Given the large volume of data, we employ maps to visually represent our findings, helping to highlight spatial patterns in accessibility. These maps will serve as the foundation for discussing the results in the following section.
4. Results and Discussion
4.1. Accessibility and travel times
Accessibility and travel times are strictly related to geography and transport infrastructure. Accessibility refers to the ease with which individuals can reach desired services or locations. It is influenced by the distance to these locations, the availability of transportation options, and the quality of the infrastructure. Travel times are the other side of the coin, encompassing the duration it takes to travel from one place to another. It is affected by factors such as the mode of transportation, traffic conditions, and the physical distance between locations.
From a purely geographical perspective, Sicily and Sardinia are the two largest islands in the Mediterranean Sea. Administratively, they are two NUTS 2 Italian regions. Examining accessibility and travel times within both islands helps to identify differences across territories within each region, and to compare them, highlighting both similarities and distinctions.
Sicily covers an area of 25,711 km², with much of its landscape dominated by mountainous terrain. Major mountain ranges include the Madonie, Nebrodi, and Peloritani, while Mount Etna, Europe’s tallest and most active volcano, is a prominent feature in eastern Sicily. Etna not only shapes the island’s landscape and contributes to soil fertility but also affects the operation of Catania’s airport when volcanic ash is released into the atmosphere. Standing at 3,369 meters, Etna is the highest peak in Sicily, where the average elevation is 413 meters. In terms of transport infrastructure, the island has more than 700 km of motorways, extending to over 1,700 km when major roads are considered. Sicily is also equipped with six airports (Catania, Comiso, Lampedusa, Palermo, Pantelleria, and Trapani), eight municipalities with ports (Augusta, Catania, Messina and Tremestieri, Milazzo, Palermo, Porto Empedocle, Termini Imerese, Trapani)—six of which have passenger ports—and 40 train stations that are classified as at least “Silver” category.
Sardinia spans an area of 24,090 km², with much of its landscape characterized by rugged mountains and rolling hills. The island’s highest peak is Punta La Marmora, located in the Gennargentu mountain range, standing at 1,834 meters. Other prominent ranges include the Monte Limbara in the North and the Sulcis mountains in the South. The average elevation of the island is 334 meters. Regarding transport infrastructure, Sardinia has no motorways, but the State Road 131 Carlo Felice (S.S. 131) serves as the main transportation artery of the island, compensating for the absence of motorways in the region. It also holds some importance beyond the island, as it is part of the multimodal corridor connecting Sardinia to the mainland, the Trans-European Transport Network, and the European route E25 (of which it constitutes the final and southernmost section). The island has three main airports (Alghero, Cagliari, and Olbia), eight ports (Cagliari, Golfo Aranci, Olbia, Oristano, Porto Torres, Portoscuso, Santa Teresa di Gallura, and Sarroch), five passenger ports (Arbatax-Tortolì, Cagliari, Golfo Aranci, Olbia, and Porto Torres), and fewer than 15 railway stations classified as at least “Silver” category. Unlike Sicily, Sardinia has no long-distance trains.
Our analysis considers six measures of internal accessibility for all Sicilian and Sardinian municipalities. Table 2 summarizes the results for each island.
The first measure under scrutiny for analyzing internal accessibility is access to essential services. As of January 1, 2021, Sicily included 390 municipalities, while Sardinia had 377. In Sicily, 8 out of 390 municipalities are located on smaller islands: Favignana, Lampedusa e Linosa, Leni, Lipari, Malfa, Pantelleria, Santa Marina Salina, and Ustica. In Sardinia, 5 out of 377 municipalities are situated on smaller islands: Calasetta, Carloforte, La Maddalena, Porto Torres (part of its territory lies on the Asinara Island and part on the mainland), and Sant’Antioco. According to the Map of Inner Areas, Istat classifies Italian municipalities based on their accessibility to three types of essential services: healthcare, education, and mobility. These services are provided by municipalities known as Cores or Inter-municipal Cores, which represent the so-called primary destination municipality (comune di destinazione prevalente, in Italian). As the distance (measured in road travel times) from these centers increases, municipalities are classified as Belt, Intermediate, Peripheral, or Ultra-peripheral. Sicily has 14 Cores (Agrigento, Caltanissetta, Catania, Cefalù, Erice, Marsala, Mazara del Vallo, Messina, Milazzo, Palermo, Ragusa, Siracusa, Termini Imerese, and Trapani), while Sardinia has 8 (Cagliari, Carbonia, Iglesias, Olbia, Oristano, Sassari, San Gavino Monreale, and Villacidro). These centers provide essential services to the remaining municipalities. Table 3 provides the distribution of municipalities according to the 2021-2027 Inner Areas classification.
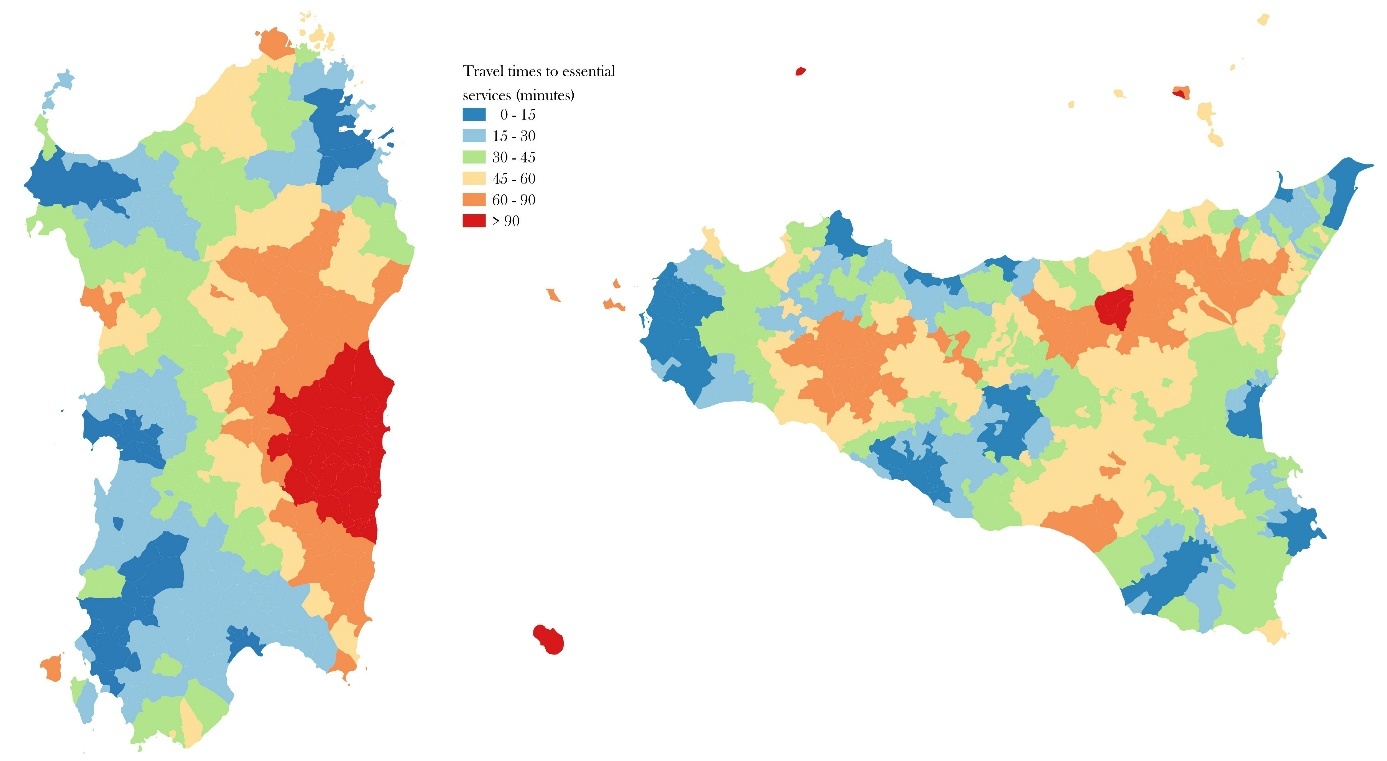
Istat notes that over 48% of Italian municipalities are classified as “belt” municipalities, meaning their travel distance to a reference hub is less than the median travel time of 27.7 minutes. Another 24.4% are classified as “intermediate”, referring to a travel distance from the hub between 27.7 and 40.9 minutes (third quartile). “Peripheral” municipalities represent 19.3% and take 40.9 to 66.9 minutes to reach the nearest hub (95th percentile). Finally, 4.8% are considered “ultra-peripheral” municipalities, where travel to the nearest hub takes more than 66.9 minutes. These percentages vary significantly by macro-region. The Center and Northeast of Italy have a larger number of cores and inter-municipal cores relative to their total municipalities. In contrast, the Northwest has the highest percentage of belt municipalities. The Islands, however, stand out with the highest proportion of peripheral and ultra-peripheral municipalities. Both in Sicily and Sardinia, travel from nearly 35% of municipalities to their reference center takes over 40 minutes, and in 11% of cases, travel times exceed one hour. In Sardinia, ultra-peripheral municipalities account for 13.5% of the total, representing the highest number (51). Sicily, instead, has, on the one hand, the second highest number (157) and proportion (40.3%) of peripheral municipalities and, on the other hand, a very low fraction (16.9%) of belt municipalities.
This distribution is illustrated in Figure 1, showing travel times by car from each Sicilian and Sardinian municipality to its primary destination municipality in 2019. A distinct spatial distribution emerges for Sardinia, with notably lower accessibility in the eastern part of the island, where travel times to the nearest hub exceed 100 minutes. For most of these municipalities, Cagliari serves as the primary service provider. The mountainous geography and the distance from Sardinia’s main highway (S.S. 131) divide the island clearly into East and West. As many as 26 Sardinian municipalities require more than an hour and a half to reach their reference hub, and 18.8% of Sardinian municipalities have travel times exceeding 60 minutes. In Sicily, the situation is somewhat more favorable, with a greater number of areas where travel times range between 30 and 45 minutes. Only 6 municipalities have travel times higher than 90 minutes, and 4 of these are in the islands of Lampedusa and Linosa, Pantelleria, Salina, and Ustica. However, in 63 municipalities (16%), travel times exceed one hour.
_to_access_essential_services_(health__education__transportation).jpeg)
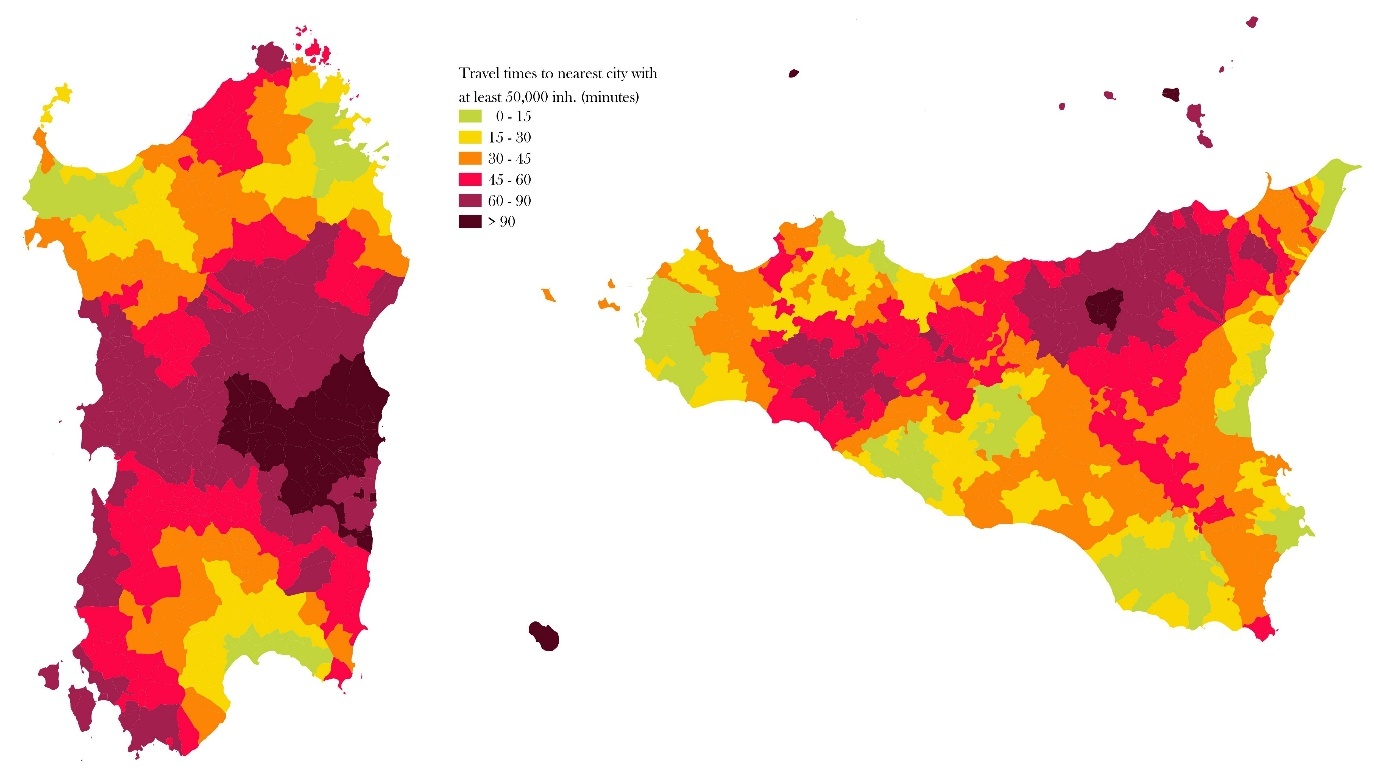
Travel times to cities serve as an alternative measure of accessibility to essential services. Large cities function as hubs for healthcare, education, retail, and specialized services, so assessing travel times to these areas helps evaluate access to these critical resources. Following the approach of Weiss et al. (2018), we include all Italian municipalities with populations exceeding 50,000 inhabitants in 2021. According to 2021 Census data, Sicily has 15 municipalities with populations of at least 50,000 inhabitants: Acireale, Agrigento, Bagheria, Caltanissetta, Catania, Gela, Marsala, Mazara del Vallo, Messina, Modica, Palermo, Ragusa, Siracusa, Trapani, and Vittoria. In Sardinia, there are four such municipalities: Cagliari, Olbia, Quartu Sant’Elena, and Sassari. Results are shown in Figure 2. In Sardinia, the eastern region has the longest travel times to cities, with 32 municipalities requiring over an hour and a half to reach a large city. In the central part of the island, travel times range between 60 and 90 minutes, affecting 122 municipalities (32%). In contrast, Sicily has a more favorable situation: aside from six municipalities on smaller islands (Lampedusa and Linosa, Pantelleria, Salina, and Ustica), only two municipalities on the main island have travel times exceeding 90 minutes. Most areas in Sicily have travel times between 30 and 45 minutes, covering 134 municipalities (34% of all Sicilian municipalities).
_to_the_nearest_city_with_at_least_50_000_inhabitants.jpeg)
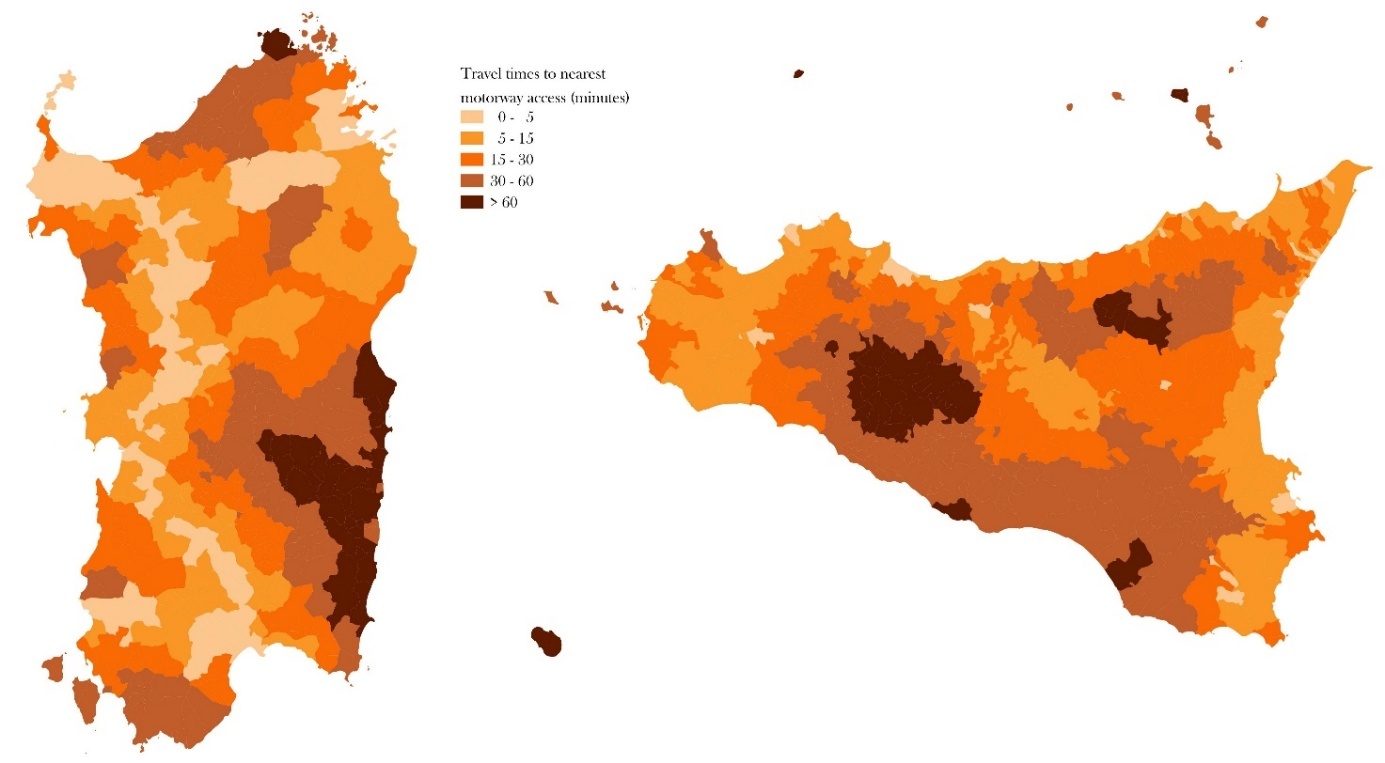
Travel times to motorway access points offer a first measure of accessibility to transport infrastructure. Since Sardinia lacks motorways, roads with a travel speed of at least 90 km/h, classified as major extra-urban roads, are used by Istat for this calculation. The results in Figure 3 highlight a contrast between southeastern and western Sardinia, as well as between central-southern and coastal regions of Sicily. In Sardinia, much of the interior and southern areas experience longer travel times. In 23 municipalities, more than one hour is required to reach a major road, and 12.5% of municipalities need more than 45 minutes. Similarly, in Sicily, central areas face significantly longer travel times. 29 municipalities, indicated in dark brown, have travel times to motorways longer than 60 minutes and 19% of municipalities need more than 45 minutes. Coastal regions, especially in the Northeast and Northwest, have more frequent motorway access, resulting in lighter spots.
_to_nearest_motorway_(sicily)_or_major_extra-urban_road_(sardinia)_a.jpeg)
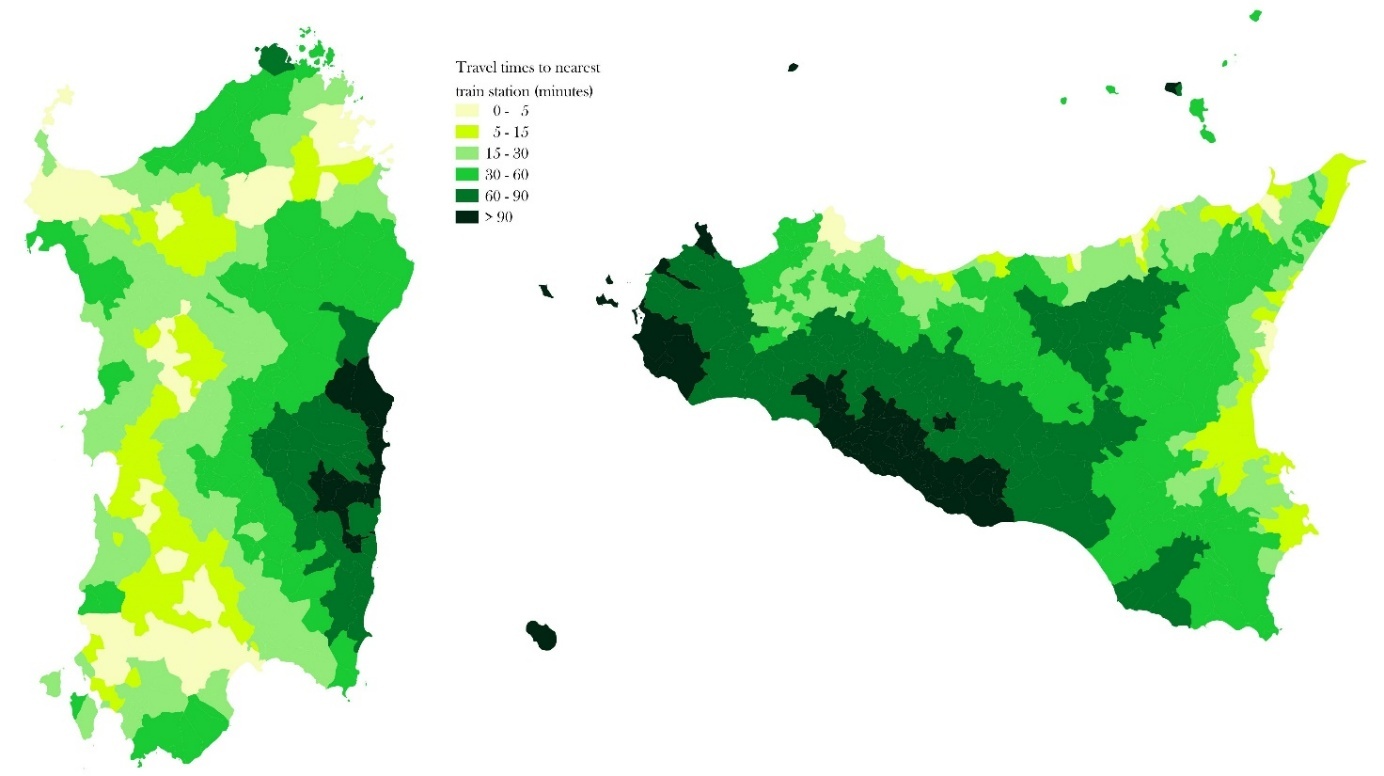
The contrast between eastern and western Sardinia is apparent in Figure 4, which illustrates travel times to the nearest railway station with active passenger service and long-distance train stops. Since Sardinia lacks long-distance trains, Istat uses regional railway stations for this calculation. In this case, there is a clear division between the East and West: 13 municipalities require over an hour and a half to reach the nearest station, while 37 municipalities take more than one hour (10% of all Sardinian municipalities). For Sicily, the disparity is noticeable between the southwestern part of the island and the rest of the region. There is a dark spot in the central region, the same area with high travel times to essential services and cities. In total, 41 municipalities (10.5% of all Sicilian municipalities) take more than 90 minutes to reach a train station, with 120 municipalities (31%) needing more than one hour.
_to_the_nearest_railway_station_with_active_passenger_service_and_lo.jpeg)
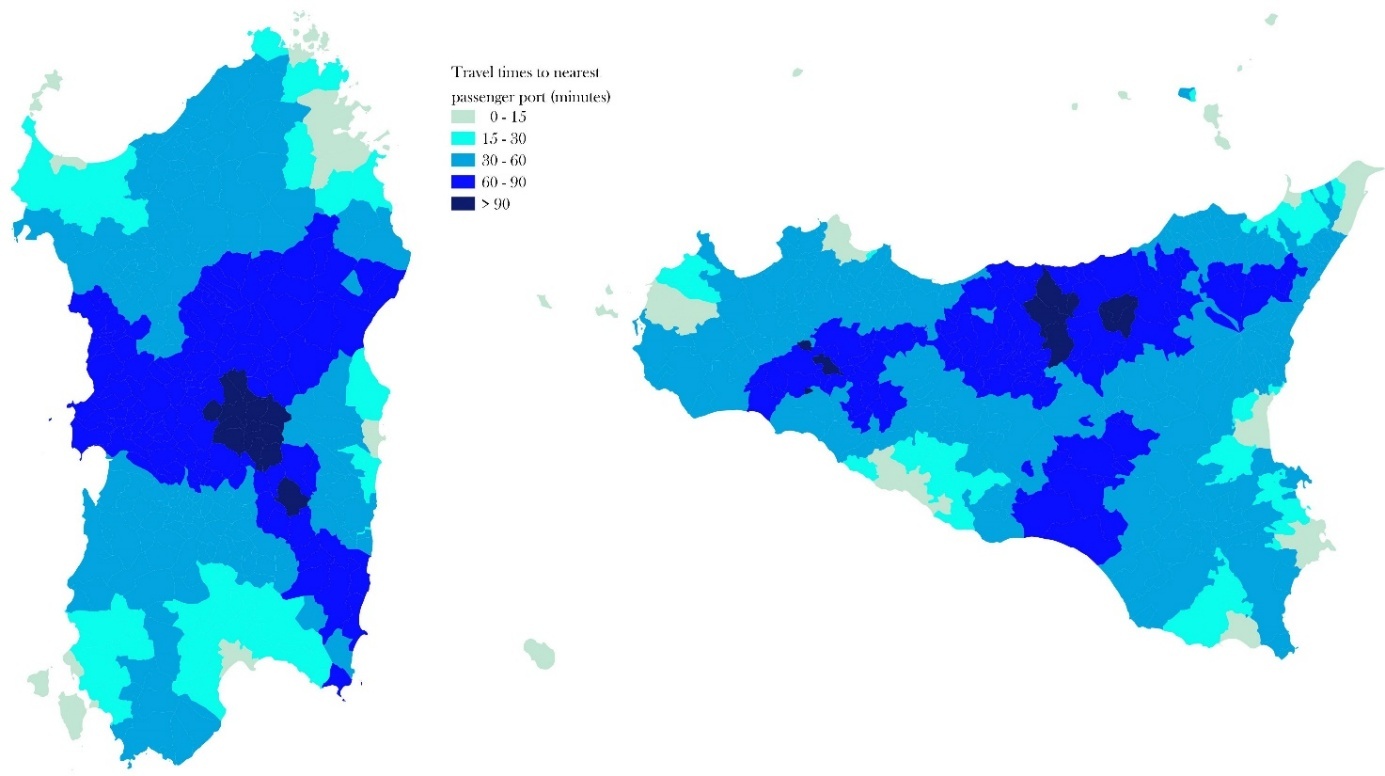
Figure 5 depicts travel times to passenger ports. As previously mentioned, Sardinia has five passenger ports, whereas Sicily has six. The accessibility of sea transport infrastructure is notably better in eastern Sardinia: Arbatax, a passenger port located in the municipality of Tortolì, allows residents in this region to reach a port in under an hour. In contrast, a large area in central Sardinia, extending into the southeastern part of the island, experiences longer travel times to ports, with durations exceeding 90 minutes (14 municipalities) or ranging between 60 and 90 minutes (122 municipalities, almost one third of all Sardinian municipalities). Similarly, in Sicily, certain regions also face travel times that exceed 60 (89 municipalities, 23% of total municipalities) or even 90 minutes to reach ports (7 municipalities). Particularly, the North-central region of the island is the most underserved, along with two areas in the Southwest and Central-South of Sicily.
_to_the_nearest_passenger_port.jpeg)
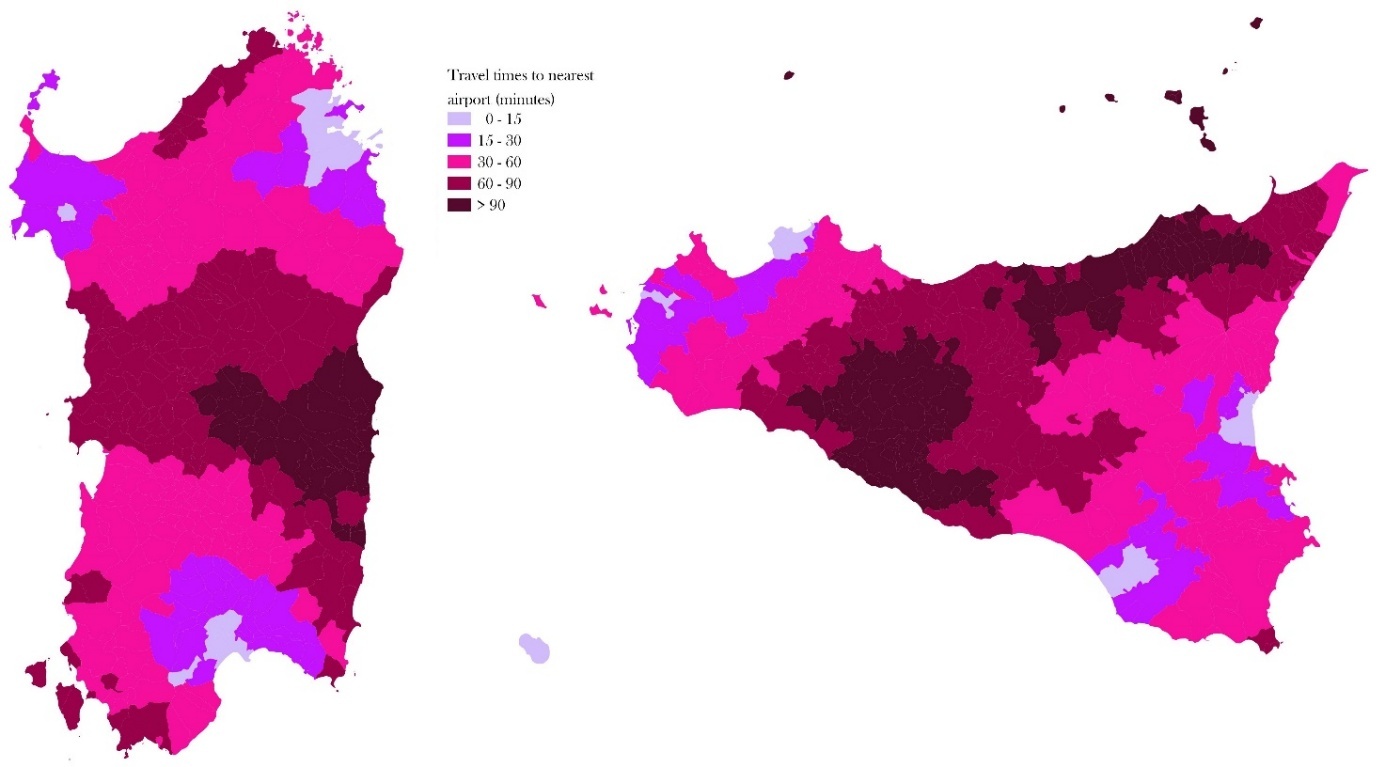
Our final measure of accessibility is depicted in Figure 6. The accessibility to airports reveals a distinct dichotomy for both islands. In Sardinia, the contrast exists between the Central-East and the northern and southern regions of the island. Once again, the most disadvantaged areas are in the East, where travel times to reach an airport exceed 90 minutes, as well as in the center of the island, where travel times range from 60 to 90 minutes. In 44% of Sardinian municipalities, more than one hour is needed to reach an airport. In Sicily, the divide lies between the central region and the island’s eastern and western areas, with a large, darker-shaded area indicating that central Sicily faces travel times to airports exceeding one hour—and in some cases, even one and a half. 94 municipalities (24% of all Sicilian municipalities) require over 90 minutes to reach an airport, while 225 (58%) need more than 60 minutes.
_to_the_nearest_airport.jpeg)
4.2. Territorial use and population mobility
The analysis of accessibility and travel times in Sicily and Sardinia reveals significant inadequacies in reaching essential destinations. Building on this, a further step is to examine islanders’ mobility—how easily residents are able to move from one place to another. It is important to note that a high level of mobility does not necessarily imply high accessibility, just as high accessibility can be achieved even with low mobility. As Cavallaro and Dianin (2022) observe, constructing a new road that connects residential and industrial areas may increase residents’ ability to travel to workplaces but does not necessarily reduce their dependence on cars. Conversely, developing residential areas that integrate diverse employment opportunities can improve access to workplaces while potentially reducing the need for extensive travel. Hence, incorporating an analysis of population patterns adds an important dimension to the study, complementing accessibility with a deeper understanding of mobility.
We use data from Istat to investigate the daily movements for study or work purposes outside the municipality of residence. According to Istat data, the car is the most widely used means of transport in Italy. Its use is deeply rooted in the southern regions and Islands, where alternatives to automobile travel appear less widespread. In 2022, 82.9% of Italians used a private vehicle for their daily travel and in 2023 commuting to work was predominantly done by car: 71.1% of workers drove their own vehicle and 5.1% traveled as passengers. Regional data confirm this pattern, with even higher rates in the Islands. In 2023, 72.2% of workers in Sicily commuted by car as drivers and 7.5% as passengers, while in Sardinia these shares are 76.5% and 4.8%, respectively. The car also plays a significant role in education-related mobility. In 2023, 37.2% of students nationwide used a car as passengers to reach school or university, a figure that climbs to 42.7% in Sicily and 46.1% in Sardinia.
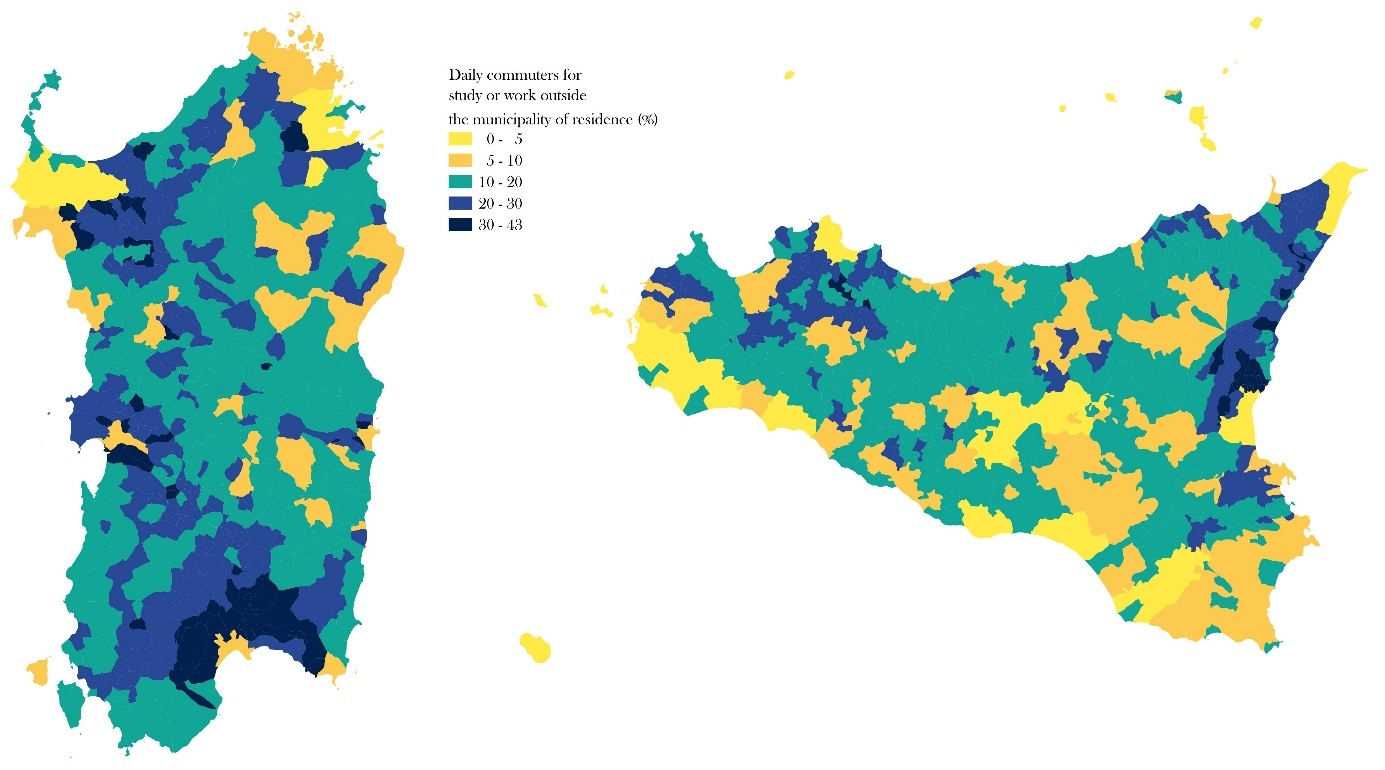
Figure 7 illustrates the share of residents commuting outside their municipality of residence for education or work in 2019. In Sicily, large municipalities such as Palermo, Catania, Messina, Marsala, Gela, and Ragusa generally exhibit low commuting rates, all below 5%, except for Siracusa at 5.5% and Trapani at 7.9%. In Sardinia, by contrast, Cagliari—the island’s main city—shows a commuting share of 9.2%, while the nearby municipality of Quartu Sant’Elena records a much higher rate at 26.2%, largely due to its proximity to Cagliari and the strong interconnection between the two. Other major Sardinian cities, such as Sassari and Olbia in the northwest and northeast respectively, display lower commuting shares, at 4.7% and 5%. Overall, the data reveal that Sardinians commute more than Sicilians: in Sardinia, 197 municipalities report commuting shares exceeding 20%, compared to 131 in Sicily. Furthermore, 45 municipalities in Sardinia record commuting rates above 30%, whereas in Sicily this is observed in only 25 municipalities.
The relationship between mobility and accessibility is also evident in Figure 7. In Sicily, municipalities along the northern coast show higher shares of residents commuting daily for work or education. This pattern is even more pronounced in Sardinia, where the highest mobility rates are observed in areas served by the S.S.131, the island’s main arterial road, which facilitates movement and connects key urban centers.
Reliance on private cars for daily mobility enables individuals to travel quickly, on flexible schedules, and to a wide variety of destinations. However, this car-centric model of mobility also shapes the built environment in ways that undermine the feasibility and efficiency of alternative transport modes, such as public transit, walking, cycling, and shared mobility services. Crucially, car dependence diminishes accessibility for those without access to a private vehicle—including older adults, young people, low-income households, and individuals with disabilities—significantly limiting their ability to reach essential destinations such as healthcare facilities, schools, employment centers, and shops.
In this sense, car dependence not only constrains individual opportunities but also reinforces social exclusion and exacerbates spatial inequalities: areas with poor public transport provision become increasingly marginalized, creating a vicious cycle of low accessibility and heightened social vulnerability.
One important lens for assessing territorial fragility in terms of accessibility is the demographic structure, particularly the share of older adults in the population. Territories with a high proportion of elderly residents are more likely to face reduced accessibility.
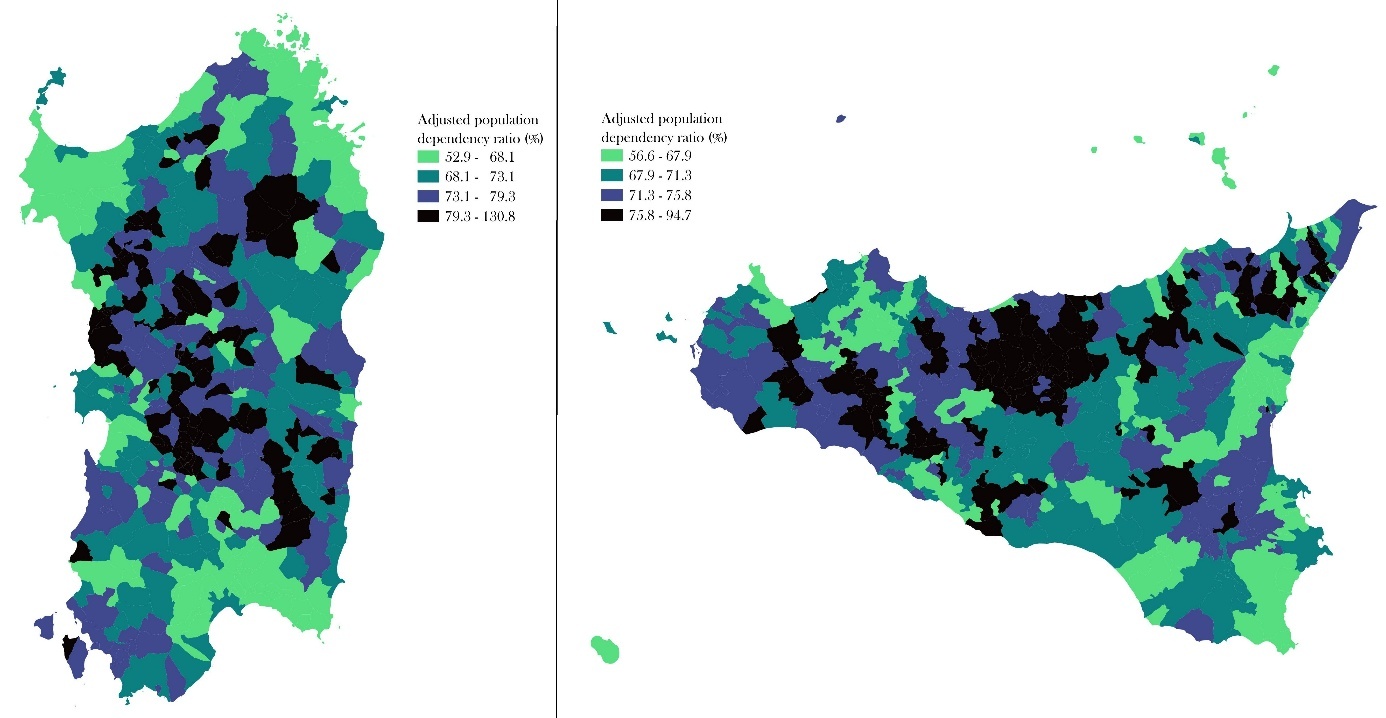
The adjusted population dependency ratio is a demographic indicator, calculated by Istat, that measures the economic and social burden placed on the working-age population (20-64 years) by the dependent age groups: the young (0-19) and the elderly (65 and over). Figure 8 illustrates the spatial distribution of adjusted dependency ratios across Sardinia and Sicily, highlighting notable intra-island disparities. In both islands, large municipalities tend to exhibit low or moderately low dependency ratios (below 75%), while smaller municipalities—particularly those located in central and more remote areas—display comparatively higher ratios. This pattern is especially pronounced in Sardinia, where the average dependency ratio hovers around 75%, with values ranging from a minimum of 53% to a peak exceeding 130%. Strikingly, as many as eight municipalities in Sardinia report dependency ratios above 100%, indicating more dependents than working-age residents. In contrast, the maximum recorded value in Sicily is lower, at approximately 95%. Nevertheless, when comparing these figures with the accessibility measures presented earlier, the picture appears less alarming. Higher dependency ratios are not exclusively concentrated in territories with poor access to cities and transport infrastructure. On the contrary, some areas with relatively good accessibility—such as western Sardinia and northwestern Sicily—also exhibit a relatively high proportion of vulnerable population groups. This suggests that improving accessibility alone may not be sufficient to address the challenges posed by demographic vulnerability. Rather, integrated policy approaches are needed—combining transport planning, service provision, and targeted social interventions—to ensure that even areas with relatively good accessibility can adequately support their ageing and dependent populations.
.jpeg)
5. Concluding remarks
This research aimed to provide a comprehensive picture of within-island accessibility, using detailed maps to represent travel times from municipalities in Sicily and Sardinia to key infrastructural access points, such as healthcare facilities, educational institutions, and transport hubs.
Focusing on these two Mediterranean islands—where Sardinia, in particular, is marked by geographic and infrastructural isolation—the paper addresses the often-overlooked internal disparities in service access faced by island populations. The issue deserves attention since internal differences add to a condition which is normally costly for citizens that live in an island, with respect to those located in mainland territories.
Our findings reveal that while both islands experience pronounced spatial inequalities, the nature and intensity of these inequalities differ. Sicily generally benefits from a more developed infrastructure network and shorter travel times to essential services. Sardinia, by contrast, especially in its eastern and central areas, faces persistent barriers to accessibility. Overall, nearly 46% of municipalities in both regions fall into the categories of “Peripheral” or “Ultra-Peripheral” under Italy’s Strategy for Inner Areas, underscoring the structural challenges of ensuring equitable territorial development within insular contexts.
These results carry significant implications for island governance and planning. First, they call for a shift in policy narratives—from conceiving of islands as uniform peripheries to recognizing their internal heterogeneity and adopting place-sensitive planning approaches. The type of infrastructure investments required varies between the two islands. In Sardinia, road infrastructure upgrades—especially secondary and mountain roads—are most urgent, particularly to improve East–West connectivity beyond the S.S. 131 corridor. In Sicily, where the road network is denser, rail infrastructure improvements—including more frequent, reliable, and accessible regional services—would yield greater returns.
In both islands, investments in digital connectivity should complement physical transport infrastructure. High-speed internet access can mitigate physical remoteness by enabling remote healthcare, education, and work—especially in the most inaccessible municipalities. These digital solutions not only reduce the reliance on long travel times but also support demographic resilience by making isolated territories more livable.
Second, improving within-island accessibility supports functional integration between remote and urban areas. Better connections have been shown to promote labor mobility, increase the reach of public services, enhance year-round tourism in inland municipalities, and improve the economic viability of sparsely populated areas. In Sardinia, in particular, such investments would help address persistent depopulation trends by making smaller municipalities more attractive for residents and businesses.
Third, from a territorial sustainability perspective, accessibility planning must strike a balance between improving connectivity and preserving environmental integrity. This calls for multimodal and low-emission mobility strategies, such as electric bus networks, integrated rail-bus hubs, and green infrastructure investments that respect landscape and biodiversity constraints. At the same time, development should be diffused to avoid excessive concentration of services and economic activities in coastal or metropolitan areas.
These recommendations align with the principles of accessibility-based planning as a sustainability tool, as proposed by Garau et al. (2022). They emphasize not just the movement of people and goods, but the capacity to access opportunities in a way that is equitable and environmentally sound.
Recapping the points in the paper, this study contributes to the island studies literature by introducing and operationalizing the concept of within-island peripherality. It challenges the conventional binary framing of islands as singular peripheries vis-à-vis the mainland and instead urges scholars and policymakers to examine the internal geographies of disadvantage. Recognizing and addressing these disparities is essential for fostering spatial justice, mitigating socio-economic exclusion, and supporting the long-term sustainability of island territories in the face of demographic, environmental, and infrastructural challenges.
Funding Declaration
This study was funded by the European Union - NextGenerationEU, Mission 4, Component 2, in the framework of the GRINS -Growing Resilient, INclusive and Sustainable project (GRINS PE00000018 – CUP F53C22000760007). The views and opinions expressed are solely those of the authors and do not necessarily reflect those of the European Union, nor can the European Union be held responsible for them.
We are grateful to the editor and two referees for their extremely valuable comments.