1. Introduction
Agriculture is constrained by limited resources that are difficult for humans to control such as geography and weather conditions that limit arable land (Brown, 2017). As countries have become more urbanized, jobs focused on the agricultural sector have declined, largely due to the growth of technologies and rural exodus (Moreno-Navarro et al., 2022). These factors drastically reduced agricultural employment, but it has had another consequence. A significant amount of agricultural land has been urbanized. Reducing the availability of agricultural land has caused the price of available agricultural land to rise in some cases (Tomal & Gumieniak, 2020). The price of agricultural land has increased to levels that companies, rather than individuals can afford (Bunkus & Theesfeld, 2018; Hełdak et al., 2022).
In Europe, the issue of the availability of agricultural land is gaining interest, as the continent is facing increasing challenges such as climate change and how it affects and increases desertification by decreasing the agricultural capacity of soils (Oñate & Peco, 2005). Wars also generate food shortages and difficulties in food production and distribution (Henriksen, 2015). Speculation on agricultural land (Roche & McQuinn, 2001) and the European Directive encouraging the use of biofuels (EU, 2018) may conflict with the availability of agricultural land for uses other than generating food for people and livestock (Banse et al., 2008). To combat climate change, rural land can also be used for nature-based solutions, leading to hydraulic and environmental engineering applications (Cesare Lama et al., 2021).
In the case of Spain, one study analyses the evolution of rural land use in the country from 1955 to 2003 (Schwarzlmüller, 2009). This evolution led to an increase in forest area and a decrease in the amount of land devoted to crops, decreasing productivity from 112 Mt/year to 63 Mt/year. Despite the progressive loss of rural land, an increasing number of national projects (de los Ríos et al., 2016) are focusing on the yield of rural soil, how to exploit it in a sustainable way to benefit the people who work on it, and to promote innovation and resilience (Lucas-Borja et al., 2019; Torres et al., 2016). On an island, the situation becomes even more complex, as the limited availability of land may clash with local objectives and different land uses (Reis & Rodrigues, 2017).
According to data published by the World Bank in 2019, agricultural employment, with respect to total employment, has been losing prominence. In the last 30 years, the ratio has been reduced by approximately 40% in terms of representation of total employment (World Bank, 2019). At the Spanish national level, agricultural employment has behaved in the same way as at the global level. This translates into a considerable drop in agricultural employment in less than 30 years, going from 10% of total employment in 1991 to 4% in 2019 (World Bank data). This fact is directly related to the rural exodus of the last decades in Spain (Llorent-Bedmar et al., 2021). In 1991, the rural population was 24.5% of the total Spanish population, while in 2019 it dropped to 19.7% (Arias Martín, 2020).
These shifts increase the importance of determining the price of land by type of crop and use. The Land Price Survey has been conducted in Spain since 2002 for this purpose. The price of land in Spain increased from 8,026 €/Ha to 10,180 €/Ha (MAPA, 2022) between 2002 and 2018, with some intervening years of slight decline. The last reductions in land prices were between 2009 and 2013 when prices fell from 10,465 €/Ha to 9,633 €/Ha. This period coincided with a slight upturn in the ratio between the percentage of agricultural jobs and total employment in Spain as the 2008 financial crisis began (Decimavilla et al., 2011).
The Canary Islands have even more limited space for cultivation than the Iberian Peninsula due to their archipelago status. The aforementioned characteristics of agriculture are even more accentuated in the Canary Islands, due to the abrupt orography, the limited territory, the scarcity of rainfall, and the presence of more or less constant winds (Cropper & Hanna, 2014). These characteristics have further reduced the areas devoted to cultivation, especially for crops that are more sensitive to inclement weather (Santamarta et al., 2022).
Specifically, the Canary Islands have a utilised agricultural area (UAA) of 9,291.58 hectares. The islands are the second largest autonomous community in Spain with the lowest UAA, behind Cantabria. In the Canary Islands, only 17.16% of UAA is arable land. The remainder is pasture or forest (ISTAC, 2020a). The researchers used the Regional Accounts of Agriculture as a source of data to determine the costs of the agricultural sector in the Canary Islands. In the period from 2015 to 2020, the intermediate consumption of the agricultural sector decreased by 6.15% for the Canary Islands. Meanwhile, the average for Spain remained practically unchanged during the same period, and the variation was less than 1%. Agricultural costs in the Canary Islands for 2020 represented 32.70% of total agricultural production, while average costs in Spain stood at 46.23% (MAPA, 2022).
Regarding land prices, a very similar situation is experienced in the Canary Islands with respect to the last update of land prices. We must emphasize that, since the beginning of the publication of the Land Price Survey (MAPAMA, 2002), the ratio €/Ha in the Canary Islands has always been much higher than in the rest of the autonomous communities. This can be related to the greater limitations the archipelago has, compared to the Iberian Peninsula, in terms of land or production costs (Quesada-Ruiz et al., 2019).
The objective of this study is to analyse existing information and literature on the average annual prices of agricultural land and the annual rural lease fees, as well as to propose a methodology for collecting this information on the island of Tenerife. For this purpose, the most representative types of crops in the Canary Islands have been differentiated and the corresponding correction coefficients have been applied, depending on the characteristics of each farm. A multiple linear regression model was used to identify the determinant variables of the price of the land. In this model, price has been defined as the dependent variable to later be able to relate it to 18 other independent variables. Results from this model identify which variables are determinants in the price of land.
The lack of predictability of land prices makes it important to provide an estimate of its uncertainty, along with the main model (Ray et al., 2023). This last measure of association reflects the proportional reduction that occurs in the sampling error when the values of an independent variable are used to predict the values of the dependent variable. In our case the dependent variable is price. The uncertainty results range from 0 to 1. The uncertainty calculation function converts a vector of real values into a vector between 0 and 1, their sum will be 1, and they can be interpreted as probabilities (Pirone et al., 2023). These probability predictions add more value to the model, as well as improve the model’s confidence (Ravuri et al., 2021).
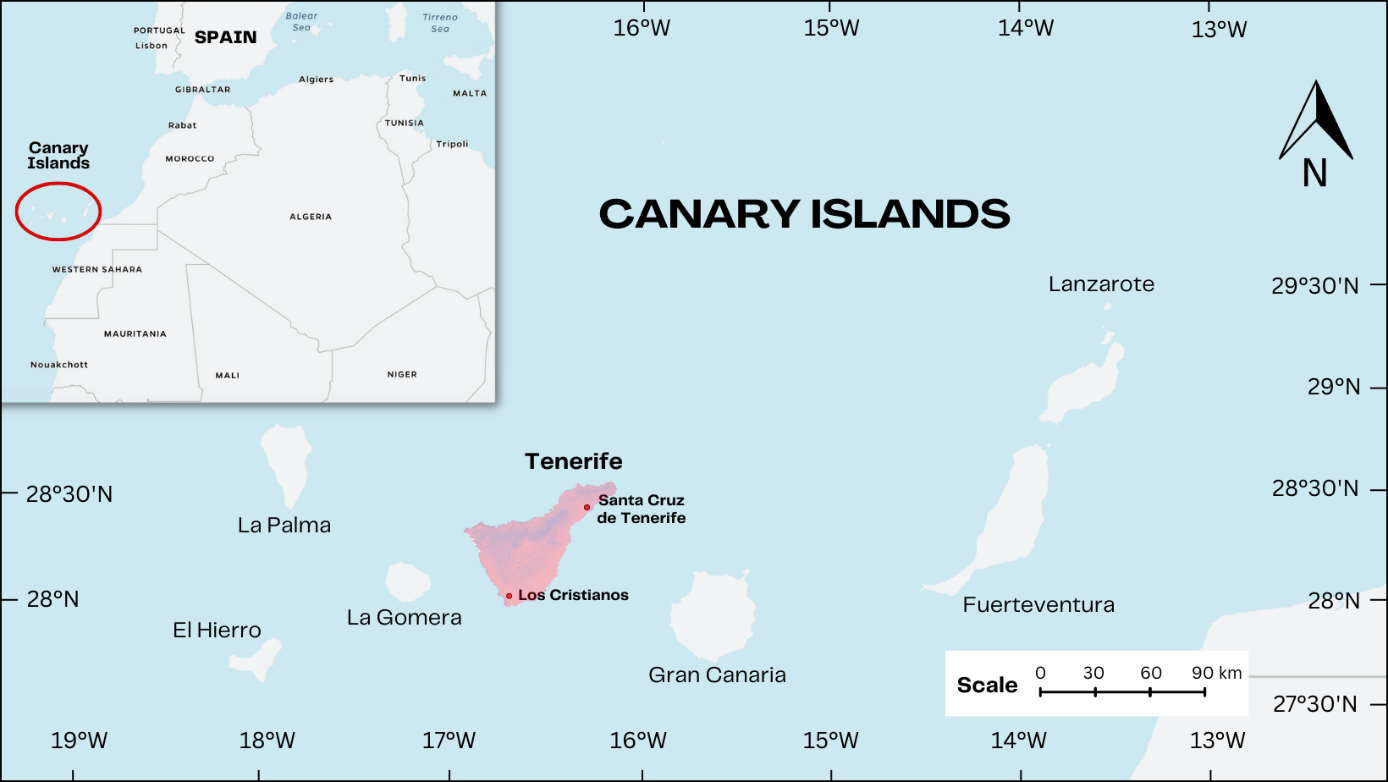
1.1. Study area
The Canary Islands are a Spanish archipelago with two capitals, the island of Tenerife and the island of Gran Canaria (Figure 1). This study focuses on the island of Tenerife, the largest island with a total area of 2,034 km2 of which 48.6% is protected land (Fernández-Lugo et al., 2011).
.png)
The interest in increasing food sovereignty (i.e., less dependence on the outside to supply the island’s food demand), the growing use of renewable energies, and water efficiency are three major challenges facing the Canary Islands in a climate change scenario (Hernandez et al., 2018). Traditionally, the islands have always significantly depended on the outside. It is valuable to know the price of land in order to take appropriate measures regarding territorial development.
Utilised agricultural area is the total area of arable land and land for permanent pasture. Arable land includes arable crops, fallow land, kitchen gardens, and land devoted to woody crops (ISTAC, 2020b). The 28 countries of the European Union have a UAA of 175 million hectares, which corresponds to 40% of the total land area. The countries with the highest UAA are Spain and France with 15.9% and 13.3% respectively. At the opposite end are the United Kingdom and Germany, both with percentages below 10% (Eurostat, 2022).
In Spain, the total amount of UAA is 18,319,104 hectares with the Canary Islands having the smallest amount of UAA behind only Ceuta and Melilla. The autonomous community of Castilla y León has the largest amount of UAA with 4,126,507 hectares, which alone represents 22.5% of the total. In total, the Canary Islands have 49,394 hectares, which represents 0.26% of the national total, far behind the next autonomous community Cantabria with 117,199 hectares. The Canary Islands are also below the Balearic Islands, which has 70% more UAA in its territory, a high figure considering that the Canary Islands have a larger total surface area than the Balearic archipelago.
We can also observe that the UAA in relation to the total surface area of Spain is, on average, 36.2%. Extremadura is the autonomous community that has the highest percentage with almost half its territory dedicated to agricultural land. The Canary Islands have the lowest percentage, with only 6.6% of their territory dedicated to agricultural land. Due to their characteristics, the autonomous communities of Ceuta and Melilla are not taken into consideration.
2. Materials and methods
Given the objective of obtaining land prices in Tenerife, we started with a multilinear regression model, complemented by a pilot survey for the island of Tenerife. The model is composed of 18 independent variables and one dependent variable, which is price (Eq.1). These variables have been chosen because they represent the most frequent crops of the islands, and the correction coefficients indicated in the Official Bulletin of the Canary Islands (BOC No. 235 of December 4, 2019) are applied.
yj=β0+β1X1j+β2X2j+…+βkXkj+εt
where
X1 is the conditions of the farm, X2 is the surface area of the farm (m2), X3 is the distance to a population centre, X4 is the slope of the farm, X5 is the type of access, X6 is greenhouse, X7 is water, X8 is pond, X9 is irrigation system, X10 is the tool space, X11 is agricultural storehouse, X12 is cattle corral, X13 is cereals, X14 is legumes, X15 is tubers, X16 is banana trees, X17 is vineyard, and X18 is pasture.
The independent variables from X1 to X12 refer to farm characteristics, construction, or improvements focused on increasing production or for specific crops. The remaining variables correspond to the types of crops grown on the different farms in the sample.
The partial coefficients of the regression are: a) β0 - the independent term of the regression, it is the expected value of the land price in Tenerife when the regressor variables are equal to zero; b) β1-β12 - measures the change in price (y) for each unit change in construction or improvements, as long as the other explanatory variables remain constant; c) β13-β18 - measures the change in price (y) depending on the type of crop owned by the farm, always keeping the rest of the explanatory variables constant. Finally, ε collects the observation error due to uncontrolled variables. It is assumed that the errors are independent and that they follow a normal distribution of zero mean and variance σ2.
We conducted a survey aimed at 20 farms in the province of Santa Cruz de Tenerife with different crops in 2021. The survey was completed in person and by telephone with the owners or tenants of the farm. All the farms analysed were professionally operated. The survey technique was chosen for its versatility and capacity to collect information. The results of the survey were used to make descriptive estimates of the object of study and to make comparisons between subgroups (Díaz de Rada, 2007).
The questionnaire consisted of 55 questions classified into three sections. The first section requested the respondent’s personal data and data on the farm to be surveyed, location, land dimensions, and type of access, among other information. The second section outlined the equipment and supplies that the farm had at the time of the survey (i.e., if it had a greenhouse, water supply, pond, agricultural warehouse, etc.). The third section detailed the types of crops and their type of use (rainfed or irrigated), as well as the valuation of the farm, either with the acquisition cost or by means of the rental fee, to make a more complete valuation of the land.
The SPSS statistical program was used to determine which variables were determinants in the final price of the crop. First, a factorial analysis was carried out to verify that the sample was valid to continue the research. Subsequently, to check which variables were determinants in the price, the rotated components matrix was performed, specifying that an extraction would be made for four components. Once separated, only those values greater than 0.7 were taken, discarding the remainder. For component 1, the determining variables were the slope of the farm, whether the farm has a pond, whether the farm has irrigation and whether there is a tack room. For component 2, the relevant variables are the contractual conditions of the farm, whether there is livestock housing and whether it is cultivated in greenhouses. Component 3 takes as determinant variables the distance to the nearest population centre and the type of access to the farm. Finally, for component 4, the only determinant variable for price is the surface area in m2.
The total variance is a measure of dispersion that measures the variability of the data explained by each component. Component 1 identifies the most variability, with 28.8% for each factor. Component 4 shows the least variability of the data at 9%. The sum of all the components explains 72.9% of the accumulated variance, therefore, it can be estimated that the number of factors (four) is sufficient.
3. Results and discussion
Internationally, research with similar objectives has been carried out, most of which is based on linear or multilinear regression models. In land price research, the concept of hedonic prices is frequently cited; this is defined as the relationship between the price of a product that is exchanged in the market and the characteristics that can vary the price of that product (Sheng et al., 2018; Tarekegn, 2021). The hedonic price model allows for a more accurate valuation of the value of land based on price data and land characteristics (Rico-Juan & Taltavull de La Paz, 2021).
Garrod and Willis (1992) conducted research on a nucleus of plots in the United Kingdom using the hedonic price model, comparing prices with the perceived prices in the purchase contracts. It was observed that there was an increase in the price of the farm if it was closer to a river or if there was direct access to the farm and to the water (Garrod & Willis, 1992).
Gwartney (2004) created a methodology based on the valuation of the price of land by other more specific methods, comparing the sale of farms with vacant plots to give a price in accordance with vacant farms, based on the size and distance to urban centres.
3.1. Average UAA prices of selected European countries
The average UAA price of the European countries that we have taken as a comparison is 17,064 euros/hectare. The Netherlands has the highest cost with an average price of 71,225 euros/hectare, 85% higher than the European average. In contrast, the country with the lowest average price is Croatia at 3,661 euros/hectare (Eurostat, 2018). Spain ranks eighth in terms of the highest average UAA prices in Europe at 10,124 euros/hectare, 10% below the European average. In comparison with Spain, France has a slightly larger usable area, but its average price is lower at 5,940 euros/hectare. In contrast, Italy, with a smaller surface area, has an average UAA price of 35,447 euros/hectare. Table 1 shows the most representative countries.
Among the countries that stand out in this type of study is the Czech Republic. In this case, the aim was to arrive at land prices based on purchase contracts in a certain time range using a multilinear regression model and to determine which factors were determinant in the final price of a farm. They take as reference the quality of the land, although land located near cities or urban centres lose weight and its price is increased by the proximity factor, among others (Curtiss et al., 2013).
3.2. UAA prices in Spain
In Spain, the Land Price Survey published annually by the Ministry of Agriculture, Fisheries and Food is significant. This survey analyses the annual evolution of average prices of the most important land used for agriculture. This is broken down by autonomous communities. This study used the most up-to-date data in the 2016 Survey on the Structures of Agricultural Holdings, prepared by the National Statistics Institute (INE). This survey has a common typology with other EU countries to enable cross-national comparisons (Segura & Marqués Pérez, 2018).
The average price of UAA at the Spanish national level is 10,124 euros/hectare. In the Canary Islands, the average price of a hectare of land is 79,001 euros/hectare, regardless of the crop grown, which is 87.2% higher than the national average price. After the Canary Islands, Andalusia, the Balearic Islands, and the Region of Murcia are the autonomous communities with the highest average price, all of which have a similar price between 19,722 and 19,775 euros/hectare. Despite being the highest, they are 75% lower than the average price of UAA in the Canary Islands (MAPA, 2022).
3.3. Prices by type of crop in Tenerife
After compiling the data from the surveys, we observed that there are five crops occurring with a higher frequency: tubers, legumes, vineyards, bananas, and cereals (Table 2). A series of characteristics are common to all the estates analysed, all of which are spread throughout Tenerife. The urban category of all the estates is rural land, and they are also located above 200 meters in elevation.
Different average prices for leasing were observed. The price per m2 for legumes is 6.42 €, and the farms that responded to the survey used a type of irrigation. Tubers are the most widespread crop, with an average price of 10.78 €/m2, and the farms analysed also had water in the orchard itself. Most of the farms had irrigation systems, the most commonly used method was drip irrigation.
Banana is the crop with the highest average rental price, at 16.52 €/m2. Blanket irrigation is used for this crop due to the large amount of water required and because the necessary inputs are higher than for other crops, hence its higher price.
Vineyards, another of the traditional crops of the Canary Islands, rented at 8.47 €/m2, and none of the farms surveyed had water. This crop in Tenerife is traditionally dry-farmed, only irrigated during the first year of planting and, in some areas, it is not necessary due to the weather conditions. It should be noted that a high percentage of the old vineyards in Tenerife are centenary and another large part is prephylloxera.
Cereals, despite not being such a widespread crop in the sample chosen for the research, are priced at 5.68 €/m2 for rent. This crop is only grown in certain areas of the island, normally in humid areas and at elevations of over 500 metres above sea level. It tends to be grown on land with less productive soil as it does not need as many nutrients as other crops. Finally, the farms used for wasteland or pasture have a value of 1.20 €/m2. In general, land intended for grazing is the most unproductive and difficult to access, which is why it is used for grazing animals or is simply abandoned.
3.4. Factorial Analysis
The Kaiser‒Meyer‒Olkin (KMO) sample adequacy measure was used for this study (Costales et al., 2022). This technique takes values ranging from 0 to 1. If the KMO measure is greater than 0.5, then the sample would be accepted because there are no variables that distort the research. As seen in Table 3, the value of the KMO sample adequacy measure is 0.542, so we accept the sample, and it is valid for our analysis.
It can also be observed that it has a significance of 0.001, which is almost perfect due to its value, therefore, the null hypothesis can be rejected, considering that the adjustment of the variables by means of factor analysis is ideal. Bartlett’s test of sphericity contrasts the null hypothesis under the hypothesis of normality. As shown in Table 3, the null hypothesis is not rejected in this research since it has a value of 0 and shows a very high correlation in the variables and can be investigated further.
To make the interpretation slightly simpler, we used the factor rotation system using Varimax Normalization, indicating that the extraction will be carried out for four components, since as previously verified, we were able to explain more than 70% of the variance. We proceeded to the extraction of factors using the principal component analysis (PCA) technique, as it has already been verified that we can apply factor analysis (FA). In our case, the matrix has been divided into four components. It should be clarified that the values higher than 0.7 reflected in Table 4 have a greater weight in the variables due to their high correlation and each component has a series of variables that are the determinants for the price of the farm: COMP 1 - the average slope of the farm, if the farm has a pond or cistern, irrigation system, or tack room; COMP 2 - farm conditions, livestock housing, and greenhouse cultivation; COMP 3 - distance to population centre and type of access; and COMP 4 - surface area in m2. The variable farm conditions have been included in COMP 2 since its value is 0.699.
Another result obtained through principal component analysis was the total variance of the components mentioned above. With this study, it is advisable to choose four components since they present a sum of the squared saturations of the rotation greater than 1 (Table 5).
It should be noted that the four components show 72.9% of the accumulated variance, so we can consider that this may be a sufficiently high value to estimate that four is an acceptable number of factors.
In the case of the island of Tenerife, the average price of land is 81,783 € per hectare. This price is higher than the average for the Canary Islands, which means that it is even further away from the national average agricultural price of €10,180 per hectare in 2021. The average price on Tenerife is eight times higher than the national level (MAPA, 2022).
Among the reasons for this high average agricultural price are the small UAA and the complex orography of the island that result in the small average size of arable land, a particularity repeated in the rest of the archipelago (Godenau et al., 2014). Another reason for the high average price is the difficulty purchasing or renting land, despite the existence of a significant amount of abandoned land. This difficulty is primarily related to owners refusing to sell or lease. Many owners demand disproportionate rents for their land and, if this is not possible, they prefer to not lease it and leave it abandoned (Martín, 2004). Finally, the following factors have reduced the availability of rural land: inefficient policy of support for the sector, instability of income, reduced incomes, strong competition with imported food, new pests, and an increase in the price of phytosanitary products, among others. These factors considerably reduced the profitability of agriculture in Tenerife and the Canary Islands (Sánchez Hernández, 2014).
Researchers identified studies with similar characteristics on the Canary Islands, based on data published in both regional and national official bulletins. Surveys created by the bodies of each autonomous community have also been used to obtain the necessary data on the price of land, highlighting the work of calculating average land prices of the Valencian community, which is based on the Survey on the Structure of Agricultural Holdings 2016, as in La Rioja, Region of Murcia or Andalusia (Colino et al., 2014).
4. Conclusions
Islands present a greater vulnerability to decreased land availability, as different land uses and the natural limitation of space compete with each other. It is important to carry out studies on land prices to help decision making, especially in a region with the highest price per square metre of rural land.
The findings of this study identified the main crops grown on Tenerife and the price of their farmland per m2. It is important to determine this price because the special conditions of the Canary Islands archipelago due to territorial limitations and the abrupt orography affect land price, as well as the value of the investments. One of the main problems of the research has been its limitation in terms of participation by agricultural entities since only 20 of those consulted agreed to participate in this study. Once the limitations were known, we determined the most frequent crops and a series of average prices were calculated with the data from our survey.
The strongest determining factors in the price of land in this study are the possession of ponds or cisterns, whether there is an irrigation system installed, the slope of the land (unevenness), and whether there is a tack room. These factors increased the price of the land. The crop with the highest price is banana, which requires water storage (pond), an irrigation system, and a tool room to store the products; the crop that requires more inputs has a higher price.
The average price of land for the Canary Islands is almost eight times higher than the European average price. It is higher than that of the Netherlands, which is the highest national average in the EU. The same is true for the average land price on the island of Tenerife, which is more than eight times higher than the national average land price. This is due to the small amount of utilized agricultural area and the complex orography of the archipelago, which means that the work, in most cases, must be done manually because of the dimensions of the machinery and the manoeuvring required. In addition, there is the problem of landowners who prefer to abandon cultivation rather than sell or lease land, mainly because of sentimental attachment to the land or because they are waiting for a possible rise in price.
Studies of this type are of particular interest in limited territories such as islands. The Canary Islands experience high pressure on the territory due to urban and tourist growth, as well as sustaining efforts to promote food sovereignty through the land dedicated to cultivation on the islands. Bananas are probably the most important agricultural product of the Canary Islands and one of the most exported, estimated at approximately 360,000 tonnes of bananas exported from the Canary Islands in 2019 (ISTAC, 2022b). This means that the land dedicated to this crop has the highest price of all those studied here.
Declaration of interests
The authors declare they have no known competing financial interests or personal relationships that could have appeared to influence the work reported in this paper.
Availability of data and materials
The data that support the findings of this study are available from the corresponding author upon reasonable request.